


|
|
DOI Prefix 10.20431 |
Information
Journal Policies
Validation of Automatic Measurement of Electroretinogram B-Wave Parameters after Elimination of Oscillatory Potentials
Minzhong Yu1,2
2 Cleveland Clinic Lerner College of Medicine of Case Western Reserve University, 9500 Euclid Avenue, Cleveland, USA.
Copyright : © 2016 Minzhong Yu. This is an open access article distributed under the Creative Commons Attribution License, which permits unrestricted use, distribution, and reproduction in any medium, provided the original work is properly cited.
Abstract
Purpose: To document and validate the feasibility to automatically measure the electroretinogram (ERG) b-wave which is often contaminated by overlying oscillatory potentials (OPs).
Methods: ERGs were recorded under dark- and light-adapted conditions from the corneal surface of C57BL/6J wild type mice, BALB/c wild type mice, 129/SvJ wild type mice and Largemyd mice. The analytic steps for b-wave parameter measurement were to (a) use a low pass filter to eliminate the oscillatory potentials (Ops), (b) to detect the b-wave maximum, (c) to measure b-wave amplitude from the minimum of the unfiltered waveform to the filtered b-wave peak, (d) to measure b-wave implicit time from the time of flash onset to the b-wave peak. The b-wave parameters derived by this method were compared to results obtained from manual measurement of the original waveform.
Results: For wild type mice, the automatic and manual measures of b-wave amplitude and implicit time were not statistically different (all P>0.05), for both dark- and light-adapted responses. The coefficients of variation were also comparable for the two measurement techniques. A similar agreement was noted for responses obtained from Largemyd mice, which have delayed b-waves.
Conclusion: This automatic measurement technique provides b-wave parameter measurements that are comparable to those measured manually. The main advantages for this approach are that much less time is required to make these measures without losing accuracy, and that consistent criteria between measurements are used to define the b-wave peak.
Keywords: Electroretinogram, mice, b-wave, measurement
1.Introduction
The electroretinogram (ERG) represents the summed electrical responses of the retina elicited by a light stimulus. By comparison to normal control values, ERG waveforms can detect functional abnormalities of different cell types in the outer retina (rod and cone photoreceptors, bipolar cells). ERGs are widely used to diagnose/monitor retinal diseases and to define genotype or effects of drug to the retinal function in human and animal research subjects [1-3]. In response to a brief flash, the ERG has two main components, which are generated by the photoreceptors (a-wave) [4] and bipolar cells (b-wave) [5]. The main parameters of these components are amplitude and implicit time [1].
ERG waveforms can be measured by manual moving of cursor on the screen of ERG device or by automatical detection of ERG peaks with a computer program. With the manual method, ERG systems require the controller to subjectively judge the position of the peak of b-wave in order to measure the amplitude and implicit time of b-wave. The presence of oscillatory potentials (OPs) upon the b-wave may complicate estimation of the b-wave peak so the manual measurement is time-consuming. According to our experience, with automatic computer program, the measurement of ERG can be finished in much shorter time than that of the manual method. The method with automatic computer program can be conducted in one of a least two simple ways. The first way is to find out the maximum data point in certain time range of the original ERG waveform as the b-wave peak. Another way is to find out the maximum data point in certain time range of the filtered ERG waveform as the b-wave peak. The first way includes the components of OPs in the b-wave which makes the explanation of b-wave data more complicated because the origins of OPs may be different from that of b-wave [2]. The second way is to measure the b-wave after significantly reduce the OPs. This study concentrates on the validation of the second method.
If the OPs are eliminated by filtering, the location of a-wave trough which is served as the reference point for measuring b-wave amplitude is usually changed. There are some alternative data points which may serve as the reference point for b-wave amplitude measurement. The mean of the baseline in certain time range, the mean of the whole ERG waveform, a specific time point at the leading edge of the a-wave in filtered or unfiltered ERG, or the a-wave trough in filtered or unfiltered ERG can be considered. Because the leading edge of b-wave starts from the a-wave trough, the unfiltered a-wave trough is the best the reference point for the measurement of b-wave amplitude to reduce the effect of the location change of a-wave trough to b-wave amplitude. An automatic computer algorithm was developed to identify the b-wave peak and thereby measure b-wave amplitude and implicit time to document and validate the feasibility of this method which description has not been found in any publications by now.
2.Methods
Dark- and light-adapted ERGs were recorded from 5 C57BL/6J wild type mice, 5 BALB/c wild type mice, 5 129/SvJ wild type mice and 4 Largemyd mice. All mice were obtained from the Jackson Laboratory (Bar Harbor, ME). We tested these mice at 2-3 months of age. Largemyd mice were tested in this study because their ERG b-wave amplitude is much lower than the regular ERG waveforms and the a-wave is often contaminated with OPs [6]. All procedures involving mice were approved by the Institutional Animal Care and Use Committee of the Cleveland Clinic Foundation.
After overnight dark adaptation, the mice were anesthetized with a mixture of ketamine (80 mg/kg) and xylazine (16 mg/kg) diluted in saline. The pupils were dilated with eye drops (1% mydriacyl, 1% cyclopentolate HCl, 2.5% phenylephrine HCl) and the corneal surface was anesthetized with 0.5% proparacaine HCl eye drops. Mice were placed on a temperature-regulated heating pad during the ERG recording session.
ERGs were recorded using a stainless steel electrode that made contact with the center of corneal surface through a thin layer of 0.7% methylcellulose. Needle electrodes were subcutaneously inserted into the cheek and the tail as reference and ground leads, respectively. The ERG responses were differentially amplified (0.3 to 1500 Hz), averaged and stored using a UTAS-E3000 Electrophysiology System (LKC Technologies, Gaithersburg, MD, USA). All wild type responses and light-adapted ERGs of Largemyd mice were digitized at 2000 Hz, using a recording epoch of 256 ms with a 20 ms pre-stimulation baseline. Because dark-adapted responses of Largemyd mice are slow [6], which responses were digitized at 1000 Hz, using a recording epoch of 512 ms with a 20 ms pre-stimulation baseline. A 60-Hz notch filter was used during dark-adapted ERG recordings. The filter was not applied in light-adapted recordings.
Stimulus flashes were presented in a LKC ganzfeld bowl. A total of ten stimulus intensities, ranging from -3.6 to 2.1 log cd s/m2, were used under dark-adapted conditions. Stimuli were presented in order of increasing intensity and at least 2 successive responses were averaged, except at the highest stimulus intensity where a single response was collected. As strobe flash intensity increased, retinal dark adaptation was maintained by increasing the inter-stimulus interval from 4.1 to 55.1 s. After the dark-adapted series were complete, a steady adapting field (1.5 log cd/m2) was presented inside the ganzfeld. After a 5 min light adaptation period [7], a total of 7 stimulus intensities ranging from -0.8 to 1.9 log cd s/m2 were superimposed against the adapting field. Cone ERGs were obtained to stimuli presented at 2.1 Hz and represent the average of responses to 50 successive stimulus flashes. The system was calibrated with a photometer equipped with a flash integrator.
The amplitude and implicit time of b-wave in dark- and light-adapted ERG were measured manually and using a computer algorithm. In the manual measurement, the b-wave peak was estimated according to the overall waveform; b-wave amplitude was then measured from the minimum point between 2 ms to 100 ms to this estimate of the b-wave peak, while b-wave implicit time was measured from the time of flash presentation to the estimated b-wave peak.
The first step of our computer algorithm, which was written in Matlab 6.0 language (The MathWorks, Inc., Natick, MA) by the author, uses a Fast Fourier Transform to remove components higher than 40 Hz. The maximum point of the filtered b-wave is chosen as the b-wave peak. The b-wave amplitude was then measured from the unfiltered a-wave trough to the peak of the filtered b-wave. The use of the a-wave section from the original waveform avoids the attenuation of a-wave amplitude by filtering, which is illustrated in Figure 1a. If the a-wave is also contaminated by oscillatory potentials, as occurs for example in Largemyd mutant mice [6], the b-wave amplitude is measured from the filtered a-wave trough to the peak of the filtered b-wave (Figure 5a). At low stimulus intensities, where an electronegative a-wave does no precede the b-wave, the program uses the minimum value between 2 to 100 ms as the reference point for b-wave measurement.
Statistical comparison of the data from the two measurements was calculated using repeated-measures one-way analysis of variance (ANOVA). Because the standard error was not constant across all pairs of means, the degrees of freedom were adjusted by multiplying by the degrees of freedom of the Greenhouse-Geisser epsilon, and significance was adjusted accordingly.
The coefficient of variation (CV) was derived in each group of measurement by calculating the ratio of standard deviation and the mean in each group, which reflects the relative inter-subject variation.
3.Results and Discussion
Figure 1 shows two examples of the measurement of b-wave amplitude and implicit time in ERGs recorded under dark- (Fig. 1a) and light-adapted (Fig. 1b) conditions. After eliminating the frequency components above 40 Hz in b-wave, the maximum point in the window between 2 ms and 180 ms in wild type of mice and between 2 ms and 280 ms in Largemyd mice is derived from the waveform, which is considered as b-wave peak. The amplitude of the b-wave amplitude is measured from this b-wave peak to the a-wave trough of the unfiltered waveform.
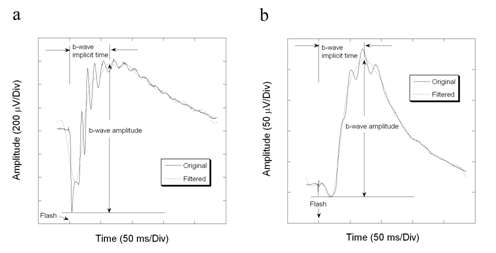
Figure1. Program measurement of ERG b-wave parameters of a BALB/c mouse with filtering technique. The frequency components above 40 Hz are filtered off for the measurement of b-wave. b-wave is the maximum point between 2 ms and 180 ms in the filtered ERG waveform. (a) Dark-adapted ERG. (b) Light-adapted ERG.
Figures 2-4 compare average (± s.d.) b-wave measures for three strains of wild type mice used in vision research (C57BL/6J, Figure 2; BALB/c, Figure 3; 129/SvJ, Figure 4). In each case, there is good general agreement between the automatic and manual measures of dark- and light-adapted b-wave amplitude (left panels of Fig. 2a,c, 3a,c, 4a,c) and implicit time (left panels of Fig. 2b,d, 3b,d, 4b,d). Repeated measures ANOVA demonstrated that there was no difference between automatic and manual measures of these b-wave parameters (all P>0.05). The right panels of Figures 2-4 also compare the coefficient of variation for these two measurement techniques. These estimates of variability were also in close agreement for the automatic and manual measures (all P>0.05).
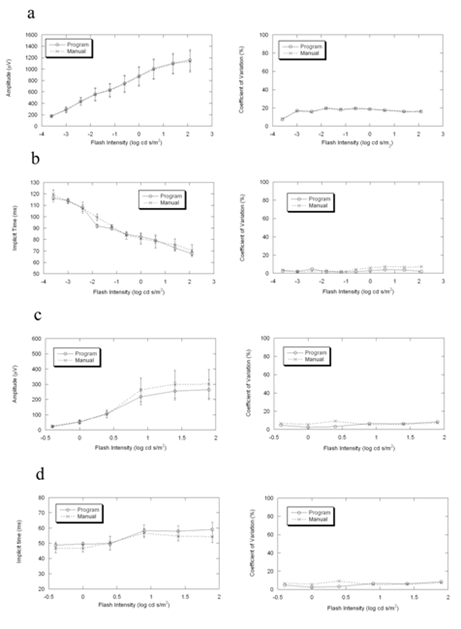
Figure2. Comparisons of the mean, standard deviation and coefficient of variation between program and manual measurements of ERG in 5 wild-type C57BL/6J mice. Under dark-adapted condition, the two results are more consistent in amplitude than in implicit time. Under light-adapted condition, the differences between the two measurements are similar in amplitude and in implicit time. In the measurement of amplitude, the two measurements are more consistent in dark-adapted condition than in light-adapted condition.
(a) b-wave amplitude in dark-adapted condition
(b) b-wave implicit time in dark-adapted condition
(c) b-wave amplitude in light-adapted condition
(d) b-wave implicit time in light-adapted condition
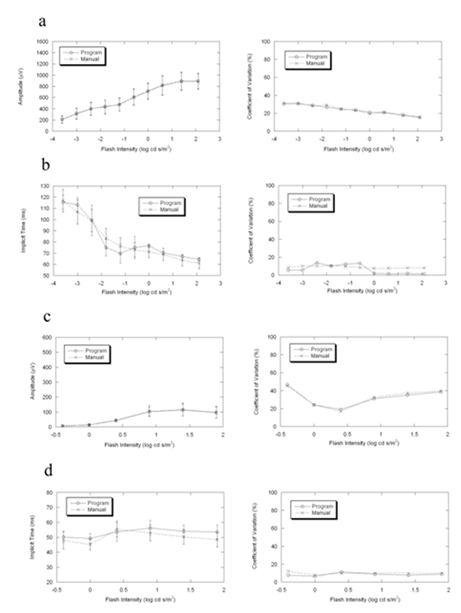
Figure3. Comparisons of the mean, standard deviation and coefficient of variation between program and manual measurements of ERG in 5 wild-type BALB/c mice. Under dark-adapted condition and light-adapted conditions, the two results are more consistent in amplitude than in implicit time.
(a) b-wave amplitude in dark-adapted condition
(b) b-wave implicit time in dark-adapted condition
(c) b-wave amplitude in light-adapted condition
(d) b-wave implicit time in light-adapted condition
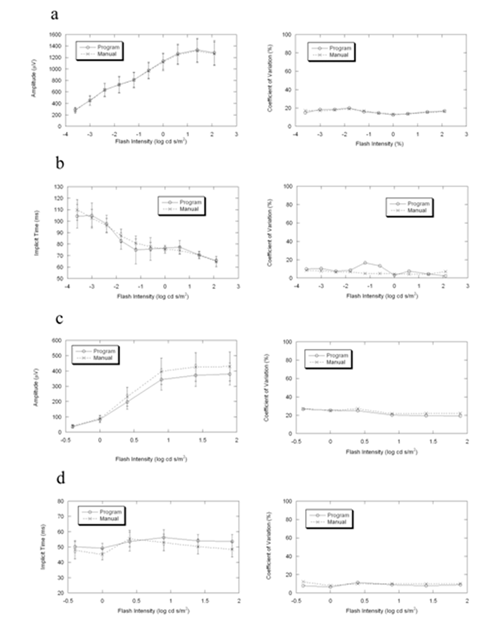
Figure4. Comparisons of the mean, standard deviation and coefficient of variation between program and manual measurements of ERG in 5 wild-type 129/SvJ mice. Under dark-adapted condition, the two results are more consistent in amplitude than in implicit time. Under light-adapted condition, the differences between the two measurements are similar in amplitude and in implicit time. In the measurement of amplitude, the two measurements are more consistent in dark-adapted condition than in light-adapted condition.
(a) b-wave amplitude in dark-adapted condition
(b) b-wave implicit time in dark-adapted condition
(c) b-wave amplitude in light-adapted condition
(d) b-wave implicit time in light-adapted condition
Figure 5 presents ERGs obtained from a representative Largemyd mouse under dark- (Fig. 5a) and light-adapted (Fig. 5b) conditions, in which the delayed b-wave characteristic of this mutant [6] can be seen. Figure 6 compares average (± s.d.) b-wave measures for Largemyd mice. There is again good general agreement between the automatic and manual measures of dark- and light-adapted b-wave amplitude (left panels of Fig. 5a, c) and implicit time (left panels of Fig. 5b, d). CVs for these measures were also comparable (right panels of Fig. 5).
Figure 2, 3, 4, and 6 show that the CVs of program measurement are better than that of the manual measurement in overall view. The data presented here indicate that the two approaches to b-wave measurement provide similar results. One advantage of an automatic approach is that subjective factors are minimized, or are at least consistent across operators. A second advantage is time. Instead of calling up individual waveforms, this approach can be used to analyze all waveforms obtained in a recording session. This approach could be incorporated into commercial systems. The computer program developed in this study is available upon request.
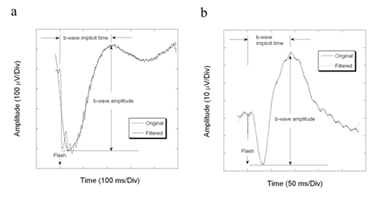
Figure5. Program measurement of ERG parameters of a Largemyd mouse with filtering technique. The high frequency wavelets on a-wave are filtered off for the measurement of the minimum of the negative component, which is the reference point for b-wave amplitude measurement.
(a) Dark-adapted ERG
(b) Light-adapted ERG
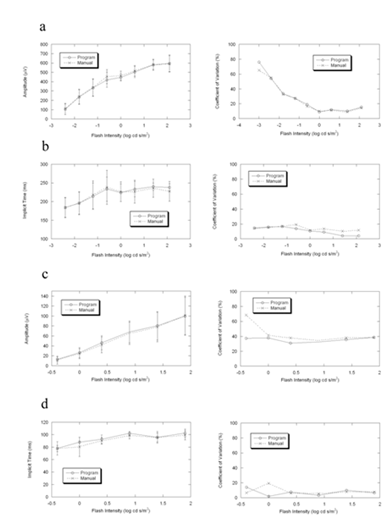
Figure6. Comparisons of the mean, standard deviation and coefficient of variation between program and manual measurements of ERG in 4 Largemyd mice. The differences between the two measurements are similar in amplitude and in implicit time under dark- and light-adapted conditions.
(a) b-wave amplitude in dark-adapted condition
(b) b-wave implicit time in dark-adapted condition
(c) b-wave amplitude in light-adapted condition
(d) b-wave implicit time in light-adapted condition
5.Acknowledgement
The author is grateful to Neal Peachey for comments on the manuscript. This work was supported by a State of Ohio BRTT grant, the NEI (R24 EY15638), and an unrestricted grant from Research to Prevent Blindness to the Department of Ophthalmology, Cleveland Clinic Lerner College of Medicine of Case Western Reserve University.
6.References
- Lam LB (2005) Electrophysiology of vision. Clinical testing and applications. Taylor & Francis Group (Boca Raton, Fl).
- Yu M, Peachey NS (2007) Attenuation of oscillatory potentials in nob2 mice. Doc Ophthalmol 115:173-186.
- Peachey NS, Ball SL (2003) Electrophysiological analysis of visual function in mutant mice. Doc Ophthalmol 107:13-36.
- Lamb TD, Pugh EN Jr (1992) A quantitative account of the activation steps involved in phototransduction in amphibian photoreceptors. J Physiol 449:719-758.
- Kofuji P, Ceelen P, Zahs KR, Surbeck LW, Lester HA, Newman EA (2000) Genetic inactivation of an inwardly rectifying potassium channel (Kir4.1 subunit) in mice: phenotypic impact in retina. J Neurosci 20:5733-5740.
- Lee Y, Kameya S, Cox GA, Hsu J, Hicks W, Maddatu TP, Smith RS, Naggert JK, Peachey NS, Nishina PM. (2005) Ocular abnormalities in Largemyd and Largevls mice, spontaneous models for muscle, eye, and brain diseases. Mol Cell Neurosci 30:160-172.
- Peachey NS, Goto Y, al-Ubaidi MR, Naash MI (1993) Properties of the mouse cone-mediated electroretinogram during light adaptation. Neurosci Lett 162:9-11.