


|
|
DOI Prefix 10.20431 |
Information
Journal Policies
ARC Journal of Surgery
Volume-2 Issue-1, 2016
Abstract
Fluorescence spectroscopy (FS) has been studied for the early detection and classification of tissues alterations of the oral mucosa. In the present non-randomized prospective trial we investigate tissue changes using FS, at 532 nm excitation, in oral cancer in situ and immediate ex vivo resected specimen with particular attention to the surgical margins.
A total of 22 patients with OSCC and 20 volunteers with normal mucosa were submitted to analysis system of FS in the exam of the subjects mucosal with oral cancer (lesions and surgical margins) and health volunteers (in several oral sites). In lesions and surgical margins the examination was carried out in situ and ex vivo. All analyzes were correlated with the pathological diagnosis.
In all patients with OSCC, we observed differences in the spectra of the border of the lesions versus surgical margins versus normal mucosa, these degree of similarity was calculated by anatomic site. The degree of similarity ranged from 15 to 50 percent depending on the anatomical site and healthy or altered mucosa, and followed the same pattern between different individuals. Differences were also observed in the moments in situ and ex vivo from the same patient. There is in all patients with OSCC distinct behaviors regarding the form and intensity considering different oral sites showed in FS, and we saw the usefulness of FS to discriminate tissue changes in surgical margins.
2.KEYWORDS
3.INTRODUCTION
4.MATERIALS AND METHODS
5.RESULTS
6.DISCUSSION
7.CONCLUSION
8.ACKNOWLEDGMENT
9.REFERENCES
AUTHOR DETAILS
Ana Lucia Noronha Francisco, DDS, PhD1, Wagner Rafael Correr2,Roger Kruger de Lima, MD1, Andre Vieira Forster, MD1, Clovis Antônio Lopes Pinto, MD, PhD3, Joao Gonçalves Filho, MD, PhD1, Cristina Kurachi, DDS, PhD2,Luiz Paulo Kowalski, MD, PhD1*
1* Department of Head and Neck Surgery and Otorhinolaryngology, A.C. Camargo Cancer Center and the National Institute of Science and Technology in Oncogenomics (INCITO), Brazil
2 Department of Physics and Materials Science, São Carlos Institute of Physics,University of São Paulo (USP), Brazil.
3 Department of Pathology, A.C. Camargo Cancer Center, Brazil
[email protected]
KEYWORDS
oral squamous cell carcinoma, fluorescence spectroscopy, surgical margins, in situ, ex vivo, oral cavity.
INTRODUCTION
Oral cancer is a complex disease where its development and progression is a result of cumulative cellular changes in molecular pathways. The most frequently used treatment for oral squamous cell carcinoma (OSCC) is surgical resection with adjuvant radiation or chemoradiation in high risk patients. The greater the extent of the lesion, the more extensive, difficult and debilitating the treatment is, a fact that impacts the quality of life of the patients and the cost of the therapy. The treatment is simpler and survival increases when the lesions are diagnosed at early stages, in addition to the achievement of adequate surgery with tumor-free margins [1-4].
―Field cancerization‖ describes the multifocal development of oral cancer and it has become apparent that gene alterations within an affected field may be diffusely present at the patient oral mucosa. This altered mucosa can contribute to the risk of local disease recurrence or the development of second primary tumors. Clinically occult fields and areas of oral potentially malignant disorders (OPMDs), represent a heterogeneous group of lesions that can widely vary in their potential for malignant transformation and metastasis. Moreover, many OPMDs and early staged OSCCs are undetectable by standard white light examination and naked eye. Even where OPMDs and OSCCs can be clinically detected, disease may extend beyond the margins currently defined using visual examination. These clinically normal mucosa adjacent to the cancer can already present molecular alterations that may later be the site for recurrent disease[5-7].
Recent advances in optical technology have provided a means for simple, cost-effective, and discriminating visualization of diseased mucosa with different auxiliary tools. Fluorescence spectroscopy (FS), has been reported to aid in the identification of OPMDs, and early oral cancers, as well as to guide the decision of site for biopsy, and of delimitation surgical margins[7-10].
Some studies have presented promising results using Near-infrared (NIR) fluorescence optical imaging technique to assess the tumor margins and cervical lymph node metastasis during cancer surgery, being the oral cancer clearly demarcated in vitro, in vivo, and on histological analysis.[11,12] Other study also using near-infrared fluorescence, the widefield epifluorescence imaging, provided sufficient contrast to visualize tumor margins and detect tumor deposits 3–5mm deep based on labeled monoclonal antibodies at low objective magnification. These results had implications for system and agent designs, which ultimately should aid complete resection in most surgical beds and provide real-time feedback to obtain clean margins.[13]
Tsui et al. showed that the field effect of oral cancer is extremely dynamic, with different genetic alterations present in different biopsies within the same tumor field. This case report also demonstrated two genetically unrelated SCCs that could be developed within 10 mm at the right lateral tongue of this patient. These findings provide evidence for the importance to implement optical technologies in defining surgical margins and support the use of whole genome technologies in the diagnosis of clonal versus independent lesions of the oral cavity, which may have implications on treatment strategies.[7]
The purpose of this study was to determine spectral characteristics to discriminate and correlate tissue changes obtained in in situ and ex vivo measurement at the normal mucosa of volunteers and at surgical tumor with pathology diagnostics.
MATERIALS AND METHODS
Patients with OSCC and healthy volunteers were evaluated with clinical examination, FS measurement, and tissue or cell pathology. All subjects were over 18 years old, both genders, smokers and nonsmokers. The biopsy site was chosen based only on clinical examination. All study subjects were investigated at A.C. Camargo Cancer Center and gave signed informed consent; the study was approved by the Ethics Committee of the institution. A homemade FS system was used in this study. The system was composed by excitation laser of 532nm frequency-doubled Nd:YAG, a Y-type probe (Ocean Optics, USA), a USB-spectrometer (USB-4000 - Ocean Optics, USA) and a laptop. The Y-type probe with two 600μm optical fibers was connected on one end to the excitation laser and the other to the spectrometer, and the investigation tip was enclosed in a handpiece. The external diameter of the interrogation tip was 2.5mm.
All participants underwent an anamnestic form containing information about the habits associated with the etiology of cancer. A thorough clinical examination was carried out, resulting in a clinical diagnosis. A mouth washing with saline was performed just before optical measurements to minimize possible contaminants in the mucosa, such as food scraps. The volunteers had fasted for at least 1 hour before optical interrogation to prevent dye intake modifying the fluorescence pattern of the investigated mucosa. Patients had fasted at least 8 hours before surgery.
The sample size was selected non-randomly when the individual sought treatment at the institution during the valid time of the collect. The pairing was by anatomic site involved, varying the size of a site to another, always doing analysis of normal mucosa of healthy individuals, normal mucosa and mucosa with lesions of individual with oral cancer, and after, a second analysis of the same point in vivo and ex vivo.
The use of excitation 532nm was chosen because previous studies14,15 have shown better results in the oral mucosa with this wavelength when compared in two different times, in vivo and ex vivo.
Each measurement site was assessed using 532 nm excitation just before the surgical procedure. In patients with heterogeneous lesions, representative regions were chosen to correlate with different clinical aspects, avoiding any area of necrosis. In each chosen site, at least 5 spectra were taken to check the variability on operator/system performance, and in surgical margins the measurements were taken in a concentric form at clockwise positions of 3, 6, 9 and 12 o´clock. All optical measurements were taken by the same operator (ALNF).
The second interrogation was performed at the resected tissue, within 10 minutes after resection, following the same protocol of the first examination. Three-mm punch biopsies were performed after clinical impression and the correlated fluorescence spectrum identified. Tissue sample was stained for HE analysis and the slides were evaluated by a single pathologist (CALP) who was blinded to the clinical impression and fluorescence data.
Normal volunteers were investigated at several oral sites: border of the tongue, floor of the mouth, lower lip mucosa, buccal mucosa, gingiva and palate, with 5 optical measurements per site. Cytological material was collected from all investigated sites using OralCDx brush and fixed with 95% ethanol for smear slide. The analysis under optical microscope was performed by same certified pathologist.
Fluorescence spectra were classified according to histopathology, the gold standard for diagnosis. Normal volunteers, clinical impression and cytological result were used for classification. First, a qualitative spectral analysis was performed by pathology, by patient and by oral site. Second, the overall spectral data was analyzed in an attempt to find spectral signatures. Finally, a classifying algorithm, using Euclidean distance, was performed to obtain the similarity degree between cancer and surgical margins, and between surgical margins and normal mucosa.
RESULTS
Twenty-two patients, 9 female and 13 male, with a mean age of 59.23 (range 32 – 82 years), 17 smokers (77.3%) were investigated in the period from May 2009 to June 2010. The most prevalent oral sites were border of the tongue and floor of the mouth.
In this study, 20 volunteers with normal mucosa and without history of cancer in the upper aerodigestive tract were included. Only 5 oral sites were included in the analysis.
With the normal volunteers, a total of 691 spectra were analyzed only in situ, and with the OSCC patients, a total of 343 in situ spectra, and of 363 ex vivo spectra taken at the border of cancer and at surgical margins, were analyzed.
Spectral comparison was performed between normal mucosa of volunteers (N), border of the cancer (C) and surgical margins (M). For the ex vivo data, the analysis compared the (C) and (M). The data were evaluated considering pathology, oral site, inter- and intra-subject, and in situ and ex vivo classes on the spectral differences.
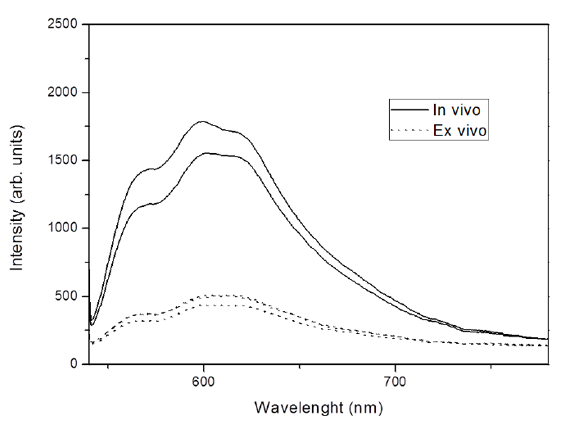
Fluorescence spectra showed distinct behaviors regarding the form and intensity considering different oral sites, clinical diagnosis, pathological findings (Figure 1) and according to the measurement moment, in situ or ex vivo (Figure 2). Figure 1A shows the border area of OSCC and Figure 1B shows the area of the surgical margin where were made the spectral measurements.
Figure1. Comparative analysis of the spectra collected in situ with the pathology, at border of the lesion, surgical margin and normal mucosa of the volunteer in the anatomical site border of tongue.
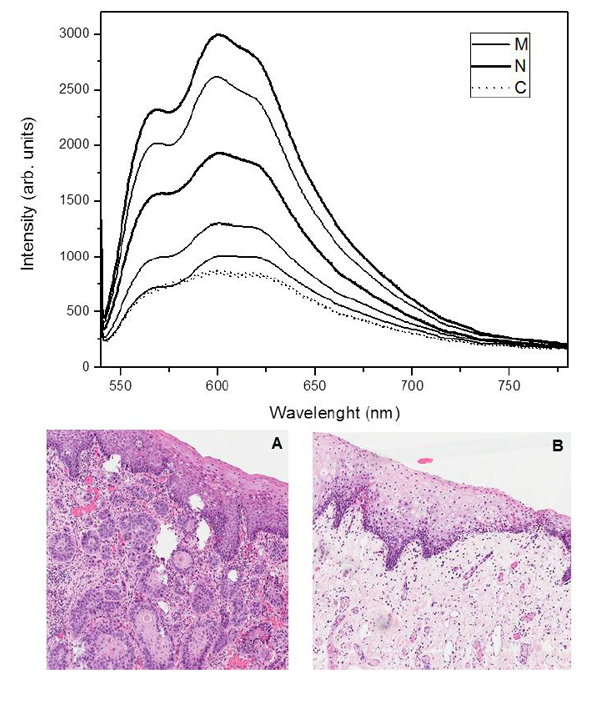
Figure2. Comparative analysis of the spectra of surgical margins in times in vivo and ex vivo of an individual with OSCC randomly chosen in site floor of the mouth
For the analysis of similarity degree, the spectra were normalized by the wavelength of maximal response in normal tissue. Thus, for excitation at 532 nm, each spectrum was divided by the response 598 nm.
After normalization, for each patient, the spectra of the margins of the lesions were compared to the average spectrum of the border of the lesions and the average spectrum of healthy tissue volunteer, all without exception in the same anatomical site. The comparison was made by calculating the Euclidean distance between the spectra. This is a conventional measure of similarity and when its value is higher, the more distinct are the spectra compared. Spectra were normalized Euclidean distance between them due to changes in its shape as a result of tissue alterations.
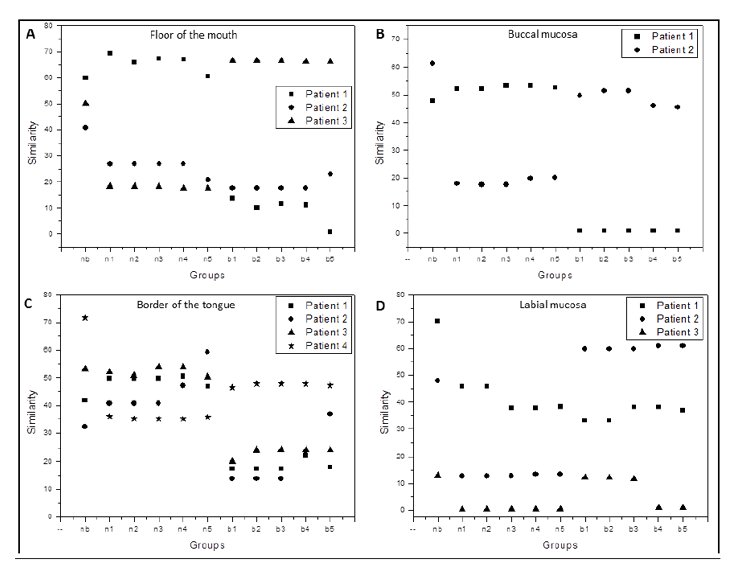
In the graphs shown in Figure 3, nb is the mean of similarity calculated between spectra N and C, n1, n2, n3, n4 and n5 are mean of similarity calculated between spectra N and M, and b1, b2, b3, b4 and b5 are mean of similarity calculated between spectra M and C.
The similarity was evaluated between surgical margin (M) and spectra from the border of lesion(C) as well as between margin and normal mucosa spectra (N). As M1 indicates a spectrum taken from a margin closer to the lesion border and M5 indicates the farther one, the comparisons follow the same logic. Thus, n1 similarity is measured between M1 region and normal tissue (N), and n2 calculated between M2 and N, successively. Analogously, b1 similarity is measured between M1 region and the lesion region (C), b2 calculated between M2 and C, etc. The nb similarity is measured between healthy tissue N and lesion region C.
It was expected that the values of the n were lower and the values of the b were higher, but this was not observed in all anatomical sites and the same results were not always corresponded with the histopathological results. The alterations may be justified due to the fact that most individuals with OSCC already show subclinical alteration in all oral mucosa, including areas of surgical margins, by harmful habits like smoking.
Figure3. Analysis of the grade of similarity in different anatomical sites
DISCUSSION
The variation of tissue architecture modifies the pattern of fluorescence spectrum collected. The biochemical composition, particularly the concentration of biomolecules absorbers, fluorophores and scatters, defines the final tissue emission. The monochromaticity of the light employed enables a greater selective of excitation of fluorophores, scatters or absorbers, making the most efficient method[6,14,16,17]. FS is a sensitive technique for discrimination of tissues, oral mucosa from distinct sites, as gingival, buccal mucosa, or tongue, present different fluorescence emissions[8,17,18].
The process of carcinogenesis involves biochemical changes in the epithelium and the extracellular matrix, modification in optical properties of these tissues is expected. The fluorescence related to collagen, and elastin, as well as increased absorbance due to angiogenesis, results in significantly reduced emission in oral dysplastic and inflammatory lesions [19,20]. The presence of inflammation may be a complicating factor for fluorescence diagnosis of oral lesions, since it is difficult to distinguish when the reduced autofluorescence is due to inflammation or to neoplasia. As the inflammation affects mainly the stroma and changes occur in the dysplastic epithelium, the evaluation should take into account the excitation wavelength, or individualized collection from the different tissue depths, to be able to distinguish the inflammatory benign lesions from dysplastic or malignant lesions [15,21].
Bacterial contamination is another important factor because some bacterias produce porphyrins, and this may change the result of the intrinsic fluorescence of the tissue. Disregarding the increased red emission, the optical discrimination has been mainly associated with a decrease in the intensity of fluorescence emitted tumor region as compared to the healthy region. This fact has been correlated with reduction of cross-linked collagen fibers and the matrix components[15,22,23].
Also observed is that the difference in clinically measured spectra at 500 nm to 560 nm emission is caused by a contribution of FAD to the total detected by fluorescence. However, it is also possible that this layer has contributions from both, the NADH and FAD, which would improve the prediction and measurement of average spectra. Thus, a direct technique for estimating the spectral characteristics of epithelial sublayers could significantly improve the accuracy of the measurements [8,14].
The spectroscopy technique investigates only a small volume of tissue, only the target point and the penetration depth of the laser in the green region is restricted to superficial layers of the tissue, this is a limitation of the technique. Poh CF et al. (2006)6 using the technique of autofluorescence widefield image showed the effectiveness of a single hand light (excitation 400-460 nm) for delineating the true extent of a tumor which, in turn, can be useful for guiding the complete removal of oral cancer in the operating room[6,23-27]. An adequate delimitation of the tumor for resection is not always precisely achieved, and the specimen shrinkage, pathological processing artifacts and difficult anatomy are negative points of the process. Other parameters pathologic as anatomic site, tumor size, depth of invasion, degree of cell differentiation, bone involvement, vascular and/or nervous and/or lymphatic invasion and presence of PMD complicate the problem[1,28,29].
Positive or close margins are associated with an increase in local recurrence rate and have a negative effect on survival rate. In pathological analysis both mucosal and deep margins of 5 mm or more are clear, 1-5 mm as close and less than 1 mm as involved, taking into consideration the shrinkage effect post-surgical which can be at least 30%. So, in order to achieve a 5 mm pathological clearance, 8-10 mm in situ surgical margin needs to be taken. Furthermore, several studies have shown that local recurrence and overall survival rate benefit from achieving negative resection margins[1,2,15,29,30]. Uniform criteria that define adequate surgical margins are lacking among head and neck surgeons.
The use of intraoperative frozen-section evaluation of surgical margins is an accepted and frequent practice in head and neck cancer resections, being a method of providing a rapid intraoperative pathology consultation. The accuracy of the frozen-section diagnosis is greater than 90% in the hands of a certified pathologist and the utility of the procedure has been well established. Re-surgery for positive margins after initial surgery is an effective treatment but it is undesirable and often not possible, beyond the fact that frozen sections are costly procedures that require multiple personnel and changes the macroscopic resected tissue[22,31-33]. These are all facts that show the importance of a better delineation of the lesion in the surgical room.
In the literature, results are found of fluorescence intensity tissue maintained in vivo and ex vivo, over a long period[34-37]. However our result, by analyzing these two moments, showed differences in fluorescence intensity and has kept only the shape of the spectra. An important observation to be discussed and studied better by the fact that in our study the ex vivo examination was performed immediately, after surgical removal of the specimen; at this time, the specimen is found in a state of ischemia-reperfusion and with alterations from metabolic cofactors when viewed in other tissues[35,38-40].
In the present study, using a single wavelength and a simple analysis of the Euclidian distance, it was not possible to discriminate the tumor margins that would potentially result in recurrence. Several methods were investigated to resolve this problem by statistical analysis of the spectral data to reduce the noise or the use in multiple wavelengths excitation. Multivariate analysis based on Principal Components Analyzes (PCA) and support vector machines were introduced to identify spectral characteristics that can be correlated with the pathology condition tissues. There are several types of mathematical procedures that were employed for a better discrimination (classification) of the samples15,25.
CONCLUSION
The results demonstrate the potential of the system of the FS to detect tissue changes in surgical margins, as a noninvasive method. More studies should be done with a large number of patients for the detection of positive margins and field cancerization.
ACKNOWLEDGMENT
The authors thank FAPESP (CEPOF-CEPID Program, proc. n° 98/14270-8, aid research proc. n° 07/57126-5 and nº 11/10802-1), CNPq (proc. n° 477439/2007-1 and proc. n° 454655/2014-2 and ALNF scholarship nº 140493/2011-5), and INCITO for financial support.
REFERENCES
- Jerjes W, Upile T, Petrie A, et al. Clinicopathological parameters, recurrence, locoregional and distant metastasis in 115 T1-T2 oral squamous cell carcinoma patients. Head Neck Oncol. 2010 Apr 20;2:9.
- Hinni ML Ferlito A, Brandwein-Gensler MS, et al. Surgical margins in head and neck câncer: A contemporary review. Head and Neck 2012.
- Looser KG, Shah JP, Strong EW. The significance of ―positive‖ margins in surgically resected epidermoid carcinomas. Head Neck Surg 1978; 1:107-11.
- Watanabe A, Taniguchi M, Tsujie H, Hosokawa M, Fujita M, Sasaki S. Clinical impact of iodine staining for diagnosis of carcinoma in situ in the floor of mouth, and decision of adequate surgical margin. Auris Nasus Larynx. 2012 Apr;39(2):193-7
- Müller MG, Valdez TA, Georgakoudi I, Backman V, Fuentes C, Kabani S. Spectroscopic detection and evaluation of morphologic and biochemical changes in early human oral carcinoma. Cancer. 2003; 97: 1681-92.
- Poh CF, Zhang L, Anderson DW, et al. Fluorescence visualization detection of field alterations in tumor margins of oral cancer patients. Clin Cancer Res. 2006 Nov 15;12(22):6716-22.
- Tsui IFL, Garnis C, Poh CF. A dynamic oral cancer field --unraveling the underlying biology and its clinical implication Am J Surg Pathol. 2009 November; 33(11): 1732–1738.
- Ramanujam, N. Fluorescence spectroscopy of neoplastic and non-neoplastic tissues. Neoplasia. 2000; 2: 89-117.
- Badizadegan K, Backman V, Boone CW, et al. Spectroscopic diagnosis and imaging of invisible pre-cancer. Faraday Discuss 2004;126:265-79.
- Bydlon TM, Kennedy SA, Richards LM, et al. Performance metrics of an optical spectral imaging system for intra-operative assessment of breast tumor margins. Opt Express. 2010 Apr 12;18(8):8058-76.
- Keereweer S, Kerrebijn JDF, Mol IM, Mieog SD, Van Driel PBAA, de Jong RJB, Vahrmeijer AL, Löwik CWGM. Optical imaging of oral squamous cell carcinoma and cervical lymph node metastasis. Head & Neck—DOI 10.1002/Hed July 2012:1002-1008.
- Keereweer S, Mol IM, Kerrebijn JDF, Van Driel PBAA, Xie B, Jong RJB, Vahrmeijer AL, Löwik CWGM. Targeting Integrins and Enhanced Permeability and Retention (EPR) Effect for Optical Imaging of Oral Cancer. Journal of Surgical Oncology 2012;105:714–718.
- Thurber GM, Figueiredo JL, Weissleder R. Detection Limits of Intraoperative Near Infrared Imaging for Tumor Resection Journal of Surgical Oncology 2010;102:758–764.
- Kurachi C, Fontana CR, Rosa LEB, Bagnato VS. Fluorescence spectroscopy for the detection of tongue carcinoma – validation in an animal model. J Biomed Optics. 2008; 13(3): 1-6.
- Francisco AL, Correr WR, Pinto CAL, Gonçalves Filho J, Chulam TC, Kurachi C, Kowalski LP. Analysis of surgical margins in oral cancer using in situ fluorescence spectroscopy. Oral Oncol. 2014 Jun;50(6):593-9.
- Welch AJ, Gardner C, Richards-Kortum R, et al. Propagation of Fluorescent Light. Lasers in Surgery and Medicine. 1997; 21: 166–178.
- De Veld DCG, Witjes MJH, Sterenborgb HJCM, Roodenburg JLN. The status of in vivo auto fluorescence spectroscopy and imaging for oral oncology. Oral Oncology 2005;41:117-131.
- Chu SC, Hsiao T-CR, Lin JK, Wang C-Y, Chiang HK. Camparison of performance of linear multivariate analysis methods for normal and dysplasia tissues differentiation using auto fluorescence spectroscopy. IEEE Trans Biomed Eng. 2006; 53: 2265-73.
- Pavlova I, Williams M, El-Naggar A, Richards-Kortum R, Gillenwater A. Understanding the biological basis of auto fluorescence imaging for oral cancer detection: high-resolution fluorescence microscopy in viable tissue. Clin Cancer Res. 2008; 14: 2396-2404.
- Lane PM, Gilhuly T, Whitehead P, et al. Simple device for the direct visualization of oral-cavity tissue fluorescence. J Biomed Optics. 2006; 11: 1-7.
- Schwarz RA, Gao W, Weber CR, et al. Noninvasive Evaluation of Oral Lesions Using Depth-sensitive Optical Spectroscopy. Cancer. 2008; 15: 1669-79.
- Messadi DV, Younai FS, Liu HH, Guo G, Wang CY. The clinical effectiveness of reflectance optical spectroscopy for the in vivo diagnosis of orallesions. Int J Oral Sci. 2014 Sep;6(3):162-7.
- Heintzelman DL, Utzinger U, Fuchs H, et al. Optimal excitation wavelengths for in vivo detection of oral neoplasia using fluorescence spectroscopy. Photochem Photobiol. 2000; 72: 103-13.
- van Staveren HJ, van Veen RL, Speelman OC, Witjes MJ, Star WM, Roodenburg JL. Classification of clinical autofluorescence spectra of oral leukoplakia using an artificial neural network: a pilot study. Oral Oncol. 2000 May;36(3):286-93.
- Xin-Hua Hu, Jun Qing Lu. Optical Detection of Cancers. Encyclopedia of Biomaterials and Biomedical Engineering. Ed. Taylor & Francis. 2005.
- Westra WH, Sidransky D. FluorescenceVisualization in Oral Neoplasia: Shedding Light on an Old Problem. Clin Cancer Res. 2006; 12(22): 6594-97.
- Upile T, Jerjes W, Sterenborg JCM, et al. Head and Neck optical diagnosis: vision of the future of surgery. Head and Neck Oncology. 2009;1:25.
- Loree TR, Strong EW. Significance of positive margins in oral cavity squamous carcinoma. Am J Surg. 1990 Oct;160(4):410-4.
- Beitler JJ, Smith RV, Silver CE et al. Close or positive margins after surgical resection for the head and neck câncer patient: the addition of brachytherapy improves local control. Int J Radiation Oncology Biol. Phys. 1998;40(2):313-317.
- Jackel MC, Ambrosch P, Martin A, Steiner W. Impact of re-resection for inadequate margins on the prognosis of upper aerodigestive tract cancer treated by laser microsurgery. The laryngoscope 2007; 117:350-356.
- Zarbo RJ, Hoffman GG, Howanitz PJ. Interinstitutional comparison of frozen section consultation. Arch Pathol Lab Med. 1991; 115:1187–1194
- Wick MR, Mills SE. Evaluation of margins in anatomic pathology: technical, conceptual and clinical considerations. Semin Diagn Pathol. 2002; 19: 207-218.
- Black C, Marotti J, Zarovnaya E, Paydarfar J. Critical Evaluation of Frozen Section Margins in Head and neck Cancer Resections. Cancer 2006;107:2792-800.
- Nazeer SS, Asish R, Venugopal C, Anita B, Gupta AK, Jayasree RS. Noninvasive assessment of the risk of tobacco abuse in oral mucosa using fluorescence spectroscopy: a clinical approach. J Biomed Opt. 2014 May;19(5):057013.
- Svistun E, Alizadeh-Naderi R, El-NaggarA, Jacob R, Gillenwater A, Richards-Kortum R. Vision enhancement system for detection of oral cavity neoplasia based on autofluorescence. Head Neck 2004;26:205-15.
- I. Pavlova, C. R. Weber, R. A. Schwarz, M. D. Williams, A. M. Gillenwater, R. Richards-Kortum, Fluorescence spectroscopy of oral tissue: Monte Carlo modeling with site-specific tissue properties, J. Biomed. Opt. 2009;14:014009.
- AlSalhi AM, Masilamani V, Atif M, Farhat K, Rabah D, Al Turki MR. Fluorescence spectra of benign and malignant protate tissue. Laser Phys. Lett. 2012; 9(9):631-635.
- Schomacker KT, Frisoli JK, Compton CC, Flotte TJ, Richter JM, Nishioka NS, Deutsch TF. Ultra-violet laser-induced fluorescence of colonic tissue: basic biology and diagnostic potential. Laser Surg Med 1992; 12:63-78.
- Ananian V, Tozzo P, Ponzano E, Nitti D, Rodriguez D, Caenazzo L. Tumoural specimens for forensic purposes: comparison of genetic alterations in frozen and formalin-fixed paraffin-embedded tissues. Int J Legal Med. 2011 May;125(3):327-32.
- Groenen PJ, Blokx WA, Diepenbroek C, Burgers L, Visinoni F, Wesseling P, van Krieken JH. Preparing pathology for personalized medicine: possibilities for improvement of the pre-analytical phase. Histopathology. 2011 Jul;59(1):1-7.