


|
|
DOI Prefix 10.20431 |
Information
Journal Policies
The Effects of Water Dose Levels on Fluid Retention and Indicators of Stomach Fullness and Illness during Sodium-Aided Hyperhydration
Elizaveta Roslanova1, Shelby Greene1, David Morris1*
Copyright : © 2018 Authors. This is an open-access article distributed under the terms of the Creative Commons Attribution License, which permits unrestricted use, distribution, and reproduction in any medium, provided the original author and source are credited.
Purpose: Sodium-aided hyperhydration has been shown to improve exercise performance in the heat. Hyperhydration investigations have used a wide range of fluid volumes, but optimum fluid consumption volumes have not been studied. We studied the effects of different water consumption volumes on fluid retention and indicators of stomach illness and fullness during a sodium-aided hyperhydration protocol. Methods: Thirteen subjects consumed water and sodium in four different isotonic volumes: 20 mL H2O/kg bm (H2O-20), 15 mL H2O/kg bm(H2O-15), 10 mL H2O/kg bm (H2O-10), and 5 mL H2O/kg bm (H2O-5). Urine was collected for two hours post-consumption and used to determine total fluid retention. Ratings of perceived stomach illness (RPI) and fullness (RPSF) were taken at the end of the hyperhydration period.
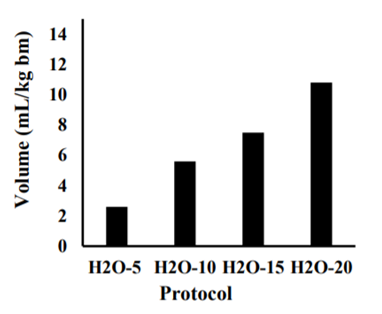
Results: Subjects retained 11±3, 8±2, 5±1, and 3±1 mL fluid/kg bm for H2O-20, H2O-15, H2O-10, and H2O-5, respectively (all P< 0.05). No significant differences were seen between protocols with respect to RPI and RPSF and values indicated that neither stomach illness nor fullness would have interfered with the performance of exercise.
Conclusion: Consuming 20 mL H2O/kg bm resulted in the highest fluid retention during sodium-aided hyperhydration. Furthermore, none of the treatments resulted in debilitating stomach fullness or illness.
Hyperhydration, Fluid Retention, Sodium, Water, Illness,Research in Sports Medicine
1. Introduction
Dehydration can have detrimental effects on performance and physiological responses during exercise in the heat [1,2]. Numerous factors may contribute to exercise dehydration including inadequate access to fluids during exercise and excessive sweat rates in relation to rates of gastric emptying and intestinal absorption for fluids [3,4]. Sodium-aided, pre-exercise hyperhydration (SAH) has been shown to effectively improve hydration status and performance during exercise in hot environments [5,6]. This technique involves consuming large quantities of water and sodium in the hours prior to exercise in the heat. Previous SAH studies have had subjects consume water volumes ranging from 10 – 20 mL∙ kg bm-1 [5-7]; however, no systematic investigations have been performed to determine the most effective fluid consumption volume to attain maximum hyperhydration.
It may seem that consuming higher doses of fluids would be more effective for inducing hyperhydration, as long as the drinks are isotonic. However, consuming large volumes of fluids could conceivably expand the plasma volume to a level that activates high-pressure baroreceptors in the myocardium resulting in excessive diuresis via release of atrial natriuretic peptide [8,9]. Furthermore, consumption of excessive amounts of fluid and/or sodium can cause gastric distress, resulting in an inability or reduced capacity to perform physical exercise. Therefore, the purposes of this study were to investigate fluid retention and stomach fullness and illness in response to four different isotonic water and sodium doses.
2. Materials And Methods
Prior to subject recruitment, the procedures of this investigation were reviewed and approved by the institutional review board of the University of Texas – Permian Basin. Thirteen physically active males (24 ± 4 yrs, 75.3 ± 9.5 kg, and 177.0 ± 8.9 cm) who were free from known digestive, vascular, and renal diseases were familiarized with their role in the investigation before signifying their willingness to participate in this study by providing written informed consent. Following the informed consent process, subjects were weighed to the nearest 0.1 kg while wearing shorts and a t-shirt. Subjects then returned to the laboratory on four separate occasions to undergo four different hyperhydration strategies and a control visit in which no fluids were consumed. Each strategy was performed over a two-hour period. The hyperhydration strategies involved consumption of two energy bars (Clif Bar & Company, Emeryville, CA) each containing 27 g carbohydrate and 105 mg sodium as a simulated “pre-event snack”, and the experimental volumes of sodium and distilled water. Water and sodium treatments were consumed in three equal doses at zero, 45, and 90 minutes of the hyperhydration protocols. The respective total water and sodium dosage levels for the four strategies were 20 mL/kg bm + 94 mg/kg bm (H2O-20), 15 mL/kg bm + 70.5 mg/kg bm (H2O-15), 10 mL/kg bm + 47 mg/kg bm (H2O-10), and 5 mL/kg bm + 23.5 mg/kg bm (H2O-5) applied in a randomly assigned, crossover design. All water and sodium doses were based on the subject’s body mass obtained during their initial visit. No food, water, or sodium were consumed during the control strategy and this strategy was performed solely to measure the ratings of perceived illness and stomach fullness. At least 72 hrs, but no more than seven days, elapsed between the application of each of the four strategies and each individual subject performed all of his four hyperhydration strategies at similar times of day.
3. Experimental Procedures
Prior to each laboratory visit, subjects followed a diet and exercise protocol that required them to refrain from alcohol, caffeine, and other methylxanthines for 72 hr. The subjects consumed a standardized, low sodium (~2400 mg) diet and refrained from exercise for 24 hrprior to each visit. Prior to participating in the hyperhydration strategies, subjects were counselled on proper food choices and were given lists of caffeine containing foods and high-sodium foods to avoid and of low-sodium alternatives. Adherence to the dietary restrictions was monitored by diet logs that were completed by the subjects as they consumed foods and liquids throughout the day. Subjects were required to consume a standardized low-sodium snack four to five hours prior to each laboratory visit. With the exception of the consumption of 0.5 L doses of water two and four hours prior to arrival at the laboratory, subjects were four hours post-prandial prior to each visit. To assess initial hydration status, subjects performed a complete bladder void upon arrival at the laboratory. From this void, a small sample of urine was used to assess urine specific gravity (USG) using a refractometer (Atago, Bellevue, WA). USG restrictions required subjects’ USG to be less than 1.020 and greater than 1.002 to assure euhydration and, to ensure consistent hydration level, none of a subject’s USGs from any of his four visits could vary by more than 0.010. If USG requirements were met, the subject’s diet record was then examined and he was asked if he followed the dietary and activity restrictions. If any of the USG, dietary, or activity requirements were not met, testing for that session was cancelled and the subject was rescheduled.
If dietary, USG, and activity requirements were met, subjects then began their hyperhydration strategy. Each strategy involved the consumption of the two energy bars, and the experimental sodium and distilled water doses. The energy bars were consumed at the beginning of each trial while the water and sodium were divided into three equal doses and consumed at the beginning, 45 min, and 90 min of the trials. Subjects were allowed five minutes to consume each of the three doses. Immediately following the consumption of the first dose, the subjects began resting quietly for two hours in a climate-controlled laboratory (21-23° C and 40-50% relative humidity) and performed a complete, measured bladder void every 20 minutes. Urine volume was measure to the nearest 5 mL using a graduated cylinder. Subjects rated their perceived stomach fullness (RPSF) and stomach illness (RPI) from 0 – 10 on Likert scalesat the end of the two-hour hyperhydration period. Ratings for RPSF ranged from no sensation of fullness (0) to extremely full and uncomfortable to move (10), while RPI ranged from no illness (0) to vomiting (10).
4. Preparation Of Experimental Treatments
Sodium was provided via commercially available, non-iodized sodium chloride. Sodium chloride was weighed to the nearest 0.1 mg, adjusting for the chloride content, using an Ohaus Adventurer SL scale (Ohaus Corporation, Parsippany, NJ) calibrated to manufacturer’s specification and placed in “0” sized gelatin capsules. Distilled water was measured to the nearest mL using a graduated cylinder and served at room temperature.
5. Statistics
All statistics were performed with SPSS 22 (IBM, Armonk, NY). Total fluid retention (total fluid consumed – total urine excreted) for each of the four strategies was expressed in mL/kg bm.USG and total fluid retention values for the four strategies were compared using separate, one-way repeated measures ANOVAs. RPI and RPSF for the four strategies plus control were compared using separate one-way repeated measures ANOVAs. Sidak post-hoc analyses were applied when appropriate. All data sets were tested for sphericity using Mauchly’s Test of Sphericity. If sphericity was violated, a Greenhouse Geisser adjustment was performed and noted in the results. Level of significance for each comparison was set a-priori at P< 0.05. All values are expressed as Means ± SD.
6. Results
USGs were 1.009 ± 0.005 (H2O-20), 1.010 ± 0.002 (H2O-15), 1.016 ± 0.028 (H2O-10), and 1.009 ± 0.005 (H2O-5). Sphericity was violated in the USG data; thus, a Greenhouse-Geisser adjustment was made for the analysis. There were no significant differences between the USGs of the four treatments (all P> 0.90), indicating that subjects were well and similarly hydrated during each of the strategies. Subjects retained approximately 50% of the water they consumed for each of the strategies and fluid retention volumes for each of the strategies were significantly different from all of the other strategies. Fluid retention volumes and P values are presented in Figure 1.
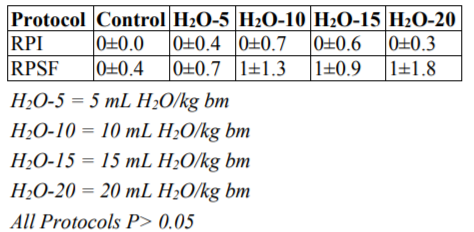
RPI and RPSF values for the control and experimental conditions indicated that none of the fluid consumption levels would have produced illness or stomach fullness that would hinder the performance of exercise. RPI measured at the end of the two-hour hyperhydration period were 0 for each strategy while RPSF ranged from zero to one with no significant differences between strategies (all P> 0.05). RPI and RPSF results are presented in Table 1.
7. Discussion
The purposes of this study were to determine the effects of different water and sodium doses on fluid retention during sodium-aided hyperhydration strategies and the effects of these doses on subjects’ rating of perceived illness (RPI) and rating of perceived stomach fullness (RPSF). Subjects consumed four different isotonic water and sodium doses: 20 mL H2O/kg body mass + 94 mg NaCl/kg body mass (H2O-20), 15 mL H2O/kg body mass + 70.5 mg NaCl/kg body mass (H2O-15), 10 mL H2O/kg body mass + 47 mg NaCl/kg body mass (H2O-10), and 5 mL H2O/kg body mass + 23.5 mg NaCl/kg body mass (H2O-5), in a two-hour hyperhydration protocol. The results demonstrated that fluid retention increased proportionally with increases in fluid and sodium consumption levels. Furthermore, RPI and RPSF data indicated that neither perceived illness or stomach fullness would interfere with the performance of exercise at the completion of the two-hour hyperhydration protocol.
Previous investigations of sodium-aided hyperhydration have utilized a wide range of fluid volumes [5-7], but no investigations have been performed to assess the effects of different fluid volumes on fluid retention levels. While it may seem logical that larger volumes of fluid would result in greater fluid retention, potential physiological responses to excessive plasma volume expansion may result in urine production volumes that increase disproportionally with increases in fluid consumption volumes. However, in the current investigation, subjects retained approximately 50-54 % of the fluid consumed during each of the four hyperhydration protocols suggesting that, when fluid consumption volumes range from five to 20 mL/kg bm, fluid retention volume increases proportionally with increases in fluid consumption volumes.
Urine production and fluid retention are tightly controlled in the kidneys by a combination of physical and hormonal factors. During hyperhydration, the expanded plasma volume increases the blood flow through the glomerulus, resulting in a greater production of filtrate. Once filtrate is produced, it can be reabsorbed by the renal tubules and peritubular capillaries and returned to the blood, or it can remain in the renal tubules and be excreted as urine. The reabsorption of the filtrate involves both passive mechanisms and active processes that are largely controlled by the hormones angiotensin II, aldosterone, and vasopressin [10]. When the body is hypohydrated, these hormones are secreted to help conserve body fluid levels by promoting the reabsorption of filtrate. During hyperhydration, release of these hormones is reduced, resulting in a decrease in filtrate reabsorption and an increase in urine production and excretion. In addition to these passive mechanisms, hyperhydration can also result in the release of atrial natriuretic peptide (ANP) from the cardiac tissue in response to increased plasma volume. ANP also promotes decreased filtrate reabsorption/increased urine production by actively excreting sodium in the nephron[9].
We were unable to measure plasma volume expansion or ANP in the current investigation. However, plasma volume expansion levels and ANP responses can be estimated and inferred from previous studies. Guyton and Hall [10] suggested a plasma volume of approximately three liters in individuals of similar size to the subjects of the current study. Thus, the fluid volumes consumed during the trials of the present investigation represented approximately 13% (5), 25% (10), 37% (15), and 50% (20) of the subjects’ plasma volumes. Grant, Green, Phillips, Enns, and Sutton [8] studied the effects of intravenous fluid (macrodex) infusion on plasma volume expansion and blood ANP levels. Compared to control conditions, infusion of 277 mL of fluid resulted in a 14% increase in plasma volume which was accompanied by a 40% increase in blood ANP levels. In a separate trial, the investigators increased the amount of infusate and expanded the plasma volume by approximately 21%. Despite the increase in the plasma volume compared to the lower-infusion trial, blood ANP levels were virtually identical in the two trials. These results suggest that maximum ANP responses may be attained with relatively minor (< 15%) increases in plasma volume. This conclusion is supported by the results of the current study by the observation that linear increases in fluid consumption volume did not result in disproportionate increases in urine excretion.
Exercise performance can be negatively impacted when dehydration levels reach approximately two percent [1] and performance decrements can be exacerbated in warm environments [2]. The subjects of the current study had an average body mass of 75.2 kg; thus, these subjects would have to lose approximately 1.5 L of fluid to reach the critical two-percent level of dehydration. Sustained sweat rates of 2.0 L per hour are common during exercise in the heat [11] meaning that the subjects of this study could reach critical levels of dehydration after 45 minutes of exercise in the heat if hydration interventions were not utilized. The hyperhydration strategies of the current investigation resulted in an increase in body fluid levels of 198 (H2O-5), 379 (H2O-10), 564 (H2O-15), and 812 (H2O-20) mL, which, at a sweat rate of 2.0 L per hour, would increase the time to critical dehydration by six, 11, 17, and 24 minutes for the H2O-5, H2O-10, H2O-15, and H2O-20 protocols, respectively.
We were concerned that the larger doses of water and sodium used in this investigation could result in illness and/or stomach fullness that could impede or inhibit physical exercise. However the RPSF and RPI at the end of the hyperhydration strategies, which would coincide with the start of a competitive event, ranged from zero to one for both measurements and none of these values differed significantly from those expressed during the control trials. Thus, it appears that none of the hydration strategies would have resulted in levels of illness or stomach fullness that would inhibit exercise or impede exercise performance.
8. Conclusion
During sodium-aided, pre-exercise hyperhydration strategies featuring fluid consumption levels ranging from 5-20 mL/kg bm, consumption of 20 mL H2O/kg bm resulted in the highest level of hyperhydration and did so while posing minimal risk of illness and stomach fullness. Furthermore, fluid retention volumes during these strategies increased in direct proportion to fluid consumption volumes, which suggests that fluid consumption levels greater than 20 mL H2O/kg bm may result in superior hyperhydration. Thus, subsequent investigations should focus on the effects of consuming larger volumes of fluid on fluid retention, stomach fullness, and illness.
References
- L. Armstrong, D. Costill, andW. Fink, Influence of diuretic-induced dehydration on competitive running performance. Med. Sci. Sports Exerc.17 (4), 456–461 (1985).
- S. Cheuvront,R. Carter, J Castellani, and M.Sawka, Hypohydration impairs endurance exercise performance in temperate but not cold air. J. of Appl. Physiol.99 (5), 1972-1976 (2005).
- G. Vistand R. Maughan, Gastric emptying of ingested solutions in man: effect of beverage glucose concentration. Med. Sci. Sports Exerc. 26(10), 1269-1273 (1994).
- M. Vukasinović-Vesić, M. Andjelković, T. Stojmenović, N. Dikić, M. Kostić, and D. Curcić, Sweat rate and fluid intake in young elite basketball players on the FIBA Europe U20 Championship. VojnosanitetskiPregled.72 (12), 1063-1068 (2015).
- S. Sims, L. van Vliet, J. Cotter, and N. Rehrer, Sodium loading aids fluid balance and reduces physiological strain of trained men exercising in the heat. Med. Sci. Sports Exerc.39 (1), 123– 130(2007).
- D. Morris, R. Beloni, H. Wofford, and E. Roslanova, Effects of acute caffeine consumption on sodium-aided hyperhydration. Sports Nutr. Therapy. 2(1). doi:10.4172/2473-6449.1000119 (2017).
- M. Coles & M. Luetkemeier, Sodium-facilitated Hypervolemia, endurance performance, and thermoregulation. Int. J. Sports Med.26 (3), 182–187 (2004).
- S. Grant,H. Green, S. Phillips, D. Enns, and J. Sutton, Fluid and electrolyte hormonal responses to exercise and acute plasma volume expansion. J. of Appl. Physiol.81 (6), 2386-2392 (1996).
- I. Kishimoto, S. Dubois, and D. Garbers, The heart communicates with the kidney exclusively through the guanylyl cyclase-a receptor: Acute handling of sodium and water in response to volume expansion. Proc. Nat. Acad. Sciences.93 (12), 6215–6219 (1996).
- A. Guyton, and J. Hall,Textbook of Medical Physiology. Philadelphia, PA: Saunders Elsevier 2006, ch. 33, p 33.
- R. Maughan, Fluid and electrolyte loss and replacement in exercise. J. Sports Sciences, 9(1), 117-142 (1991).