


|
|
DOI Prefix 10.20431 |
Information
Journal Policies
Monitoring Training Load Using the Acute: Chronic Workload Ratio in Non-Elite Intercollegiate Female Athletes
Ian Foster1*, Paul J. Byrne 1, Jeremy A. Moody2, Paula A. Fitzpatrick1
2.Cardiff School of Sport, Cardiff Metropolitan University, Llandaff Campus, Western Avenue, Cardiff, Wales.
Copyright : © 2018 Authors. This is an open-access article distributed under the terms of the Creative Commons Attribution License, which permits unrestricted use, distribution, and reproduction in any medium, provided the original author and source are credited.
Monitoring training load and its progression in athletes is important to optimise adaptations to training while simultaneously preventing injury. A recent development in this field is the acute: chronic workload ratio (ACWR), which track s average acute training load against average chronic training load to describe training load progression. Furthermore, a new method of calculating the ACWR has been developed using exponentially weighted moving averages (EWMA) which accounts for the decay of fitness and fatigue. This study sought to investigate the relationship between the EWMA and ACWR (based upon session rating of perceived exertion (sRPE)), and injury risk in intercollegiate female athletes (N=4). Participants performed adductor squeeze tests (ASTs) once a week for 8 week s, while their training and wel lness were monitored with sRPE and a daily questionnaire respectively. A hierarchical regression demonstrated that monitoring of average sleep length, average stress, sRPE work loads and an EWMA provided the best model for predicting injury risk in athletes (R2 = 0.47). The findings indicate that the EWMA may be a effective training load monitoring tool than the ACWR model.
ACWR, EWMA, training load, injury risk
ACWR: Acute chronic workload ratio, sRPE: Session rating of perceived exertion, EWMA: Exponentially weighted moving average, AST: Adductor squeeze test, DOMS: Delayed onset muscle soreness.
1. Introduction
The acute: chronic workload ratio (ACWR) is an index of training stress an athlete experiences relative to the fitness they have accrued through their chronic exposure to training [1]. The ACWR is based on the fitness-fatigue theory of the body’s response to training [2, 3], and was developed to assist practitioners balance the training of athletes for competition with the risk of overtraining and increasing injury risk. Evidence has established a link between excessive training loads and increased injury risk [4, 5].
A relationship between training load calculated through session rating of perceived exertion (sRPE) and injury was demonstrated when monitoring training loads of Division III intercollegiate female basketball players over a 20-week period [5]. The study reported a moderate correlation between total weekly training load and incidence of injury within one week (p < 0.01, r = 0.675). Furthermore, a relationship existed between spikes in acute workload and spikes in weekly injuries. For example, following a week of no training, the subsequent rise in workload to previous levels showed an associated increase in injury occurrence. Based upon this study and others, it may be concluded that excessive spikes in acute workloads relative to chronic workloads are a contributor to injury risk in athletes [5-8].
There are limitations to the proposed model of the ACWR. Studies have outlined that this model does not account for the decaying nature of fitness and fatigue [9, 10]. The ACWR model calculated using rolling averages [11-13] provides equal weight to a session across the entirety of the acute and chronic periods. Recent studies have explored the ability of an exponentially weighted moving average (EWMA) to evaluate injury risk relative to the ACWR [9, 10]. The EWMA utilises a decay factor for both the acute and chronic load values that allow for the decaying nature of fitness and fatigue. Research has demonstrated that using the EWMA to calculate an ACWR may be better suited to identifying increased athlete injury risk compared to calculating the ACWR with rolling averages [9]. Furthermore, the ACWR has been investigated predominantly in elite athletes [1, 11, 13-15]. To the best of our knowledge, research is sparse in relation to its efficacy in non-elite athletes, even though evidence suggests that the ACWR could be useful in sub-elite rugby league players [16], or in the efficacy of using different tests which measure athlete injury risk and athlete readiness as opposed to actual injury incidence.
Reduced adductor muscle strength, as tested with an adductor squeeze test (AST), has demonstrated a relationship with increased groin injury incidence [18]. It has yet to be ascertained whether AST values and their fluctuation over time shares a relationship with the ACWR or EWMA. Furthermore, it has yet to be investigated if the ACWR or EWMA has a relationship with wellness markers or AST measures. Certain wellness factors (sleep length) and psychological factors (stress levels and mood) have been linked to injury incidence also [19-22].
It has been reported that injury is related to wellness [17, 19, 22], excessive training loads determined by sRPE [5, 16] and the ACWR, calculated using rolling averages [1, 12, 13, 15] and an EWMA [9]. Moreover, a relationship between training loads and perceived wellness has been established [23]. Research to date has not identified the degree to which calculating an ACWR is of additional benefit to practitioners. This research is necessary to determine if the addition of either of these indexes has a meaningful impact on the monitoring of injury risk in measures beyond measures such as wellness and sRPE.
Based on the findings of previous research this study aims: 1) to determine if the ACWR and/or EWMA calculated with sRPE shows an association with changes in injury risk and/or wellness markers in recreational female intercollegiate athletes and 2) to assess whether the addition of the ACWR or EWMA into an injury risk prediction model will significantly improve its efficacy. It is hypothesised that 1) the EWMA and the ACWR will related to injury risk and 2) the EWMA will be a more effective tool for explaining variance in both.
2. Methodology
Seven female team sport athletes (20.9 ± 3yrs) with an average height of 158.4 ± 5.1cm and an average body mass of 68.0 ± 10.4kg volunteered to participate in the study. The participants had a playing history in a team sport (rugby or soccer) of a minimum of 3 years while also being currently involved in competitive team sport at an intercollegiate level. The average playing experience of these athletes was 5 ± 2.4yrs. On average the athletes performed two team field sessions per week with one match each week. Any additional training was done at the discretion of the athletes. Participants were excluded from testing if they had suffered from any lower-body injury within the last three months. All participants were medically screened and provided informed written consent. Ethical clearance for the study was provided by the Departmental ethics board.
Participants were taken through a familiarisation session, in which they were provided with further information about the investigation. Furthermore, the participants were measured for their height and body mass using a stadiometer (Seca 264, Seca GmbH, Hamburg, Germany) and a scales (Seca 703, Seca GmbH, Hamburg, Germany). Participants were instructed how to correctly perform an AST before being tested. Participants were required to abstain from any strenuous exercise for 24 hours prior to testing.
AST testing was performed as per the procedures used in previous research [18]. Participants lay supine with their feet on the ground and knees flexed to 45 degrees and a sphygmomanometer (Welch Allen Disytest, Skaneatles, New York, USA) was placed between their knees. The sphygmomanometer was pre-inflated to 10mmHg prior to commencing the test. Participants performed three submaximal trials before performing four maximal trials, with 15 seconds rest between maximal squeeze efforts. The mean was recorded for the session and used for later analysis.
A second testing session occurred a minimum of 48 hours post familiarisation, where the AST was retested in order to improve the strength of the mean used in analysis. The reliability of the AST [24] has been previously reported.
The athletes retested their AST once per week for 8 weeks during the study. Testing occurred at the same time each week to eliminate the influence of diurnal effect on performance. The athletes performed three trials during each session, with 15 seconds rest between trials.
Over the course of the study, the athletes also completed a daily wellness questionnaire, which detailed six multiple-choice questions as well as a section that detailed their training load for the day. In accordance with previously reported wellness markers associated with injury, questions were included that focused on sleep length and quality [20], psychological factors i.e. stress levels and mood state [22]. Appetite levels were also monitored subjectively given that loss of appetite has been reported to be a symptom of overtraining [25]. A question was included on muscle soreness to account for the potential occurrence of delayed onset muscle soreness (DOMS) over the course of the observation [26]. The questions were designed using a 5-point Likert scale where a response of 5 was deemed to be the most positive response (e.g. most hours slept, least amount of stress, best mood etc.) and 1 was the most negative response (e.g. least hours slept, most amount of stress, worst mood etc.). The responses to each question were subjective and based on how the participants’ currently felt about each item upon answering the question, in a manner similar to that of Gastin et al. [27]. Our questionnaire also recorded details of the participants’ training load over the observation period, which was calculated using the sRPE method [28].
The ACWR index of training load was calculated using rolling averages, with 7 days given to the acute load and 28 days to the chronic load [1, 9, 12-14]. The average of the acute (7-day) period was divided by the average of the chronic (28-day period) to create the ACWR. The EWMA was calculated using an equation that utilised a decay factor specific to the acute and chronic timeframes to account for the decaying nature of fatigue and fitness. The EWMA was calculated as follows:
The λa here was a number between 0-1 that attributes a decay rate to the load value. This decay rate was calculated as:
In this equation, N is the chosen time-decay constant, or in this scenario the time given to the acute (7 days) and the chronic (28 days) periods. These calculations were performed as per Murray et al. [9].
Normality was assessed for the data set using a Shapiro-Wilk’s test and skewness. A Pearson’s correlation coefficient was used to investigate the existence of correlations between: 1) sRPE, ACWR and EWMA with AST scores; 2) sRPE, ACWR and EWMA with wellness markers. A regression analysis was performed to determine the variance in injury risk (represented by AST scores) explained by the ACWR and EWMA, using a 3-step hierarchical regression. Confidence intervals were set at 95% and significance at p < 0.05. All analyses were performed using IBMM SPSS statistics v23.0 (IBM Corp., Armonk, NY).
3. Results
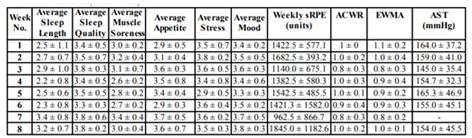
Of the original seven participants, one withdrew due to injury and two were removed from data analysis for non-compliance. Descriptive statistics for wellness data and workload measures taken over the course of the investigation are provided in Table1.
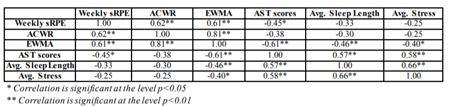
Correlations between workloads as measured by sRPE, ACWR, EWMA and AST scores are displayed in Table 2. Weekly sRPE showed a significant negative correlation with AST scores over the observation period (r = -0.45, p < 0.05). Furthermore, the EWMA demonstrated a significant negative correlation with the AST scores (-0.61, p< 0.01). There was no significant correlation between the ACWR and AST scores.
Table 2 displays the significant correlations between wellness markers and measures of workload, workload indexes and external measures of fatigue and injury risk. Only average sleep length and average stress levels had any significant correlation with a variable (EWMA and AST scores) that was not a wellness marker.
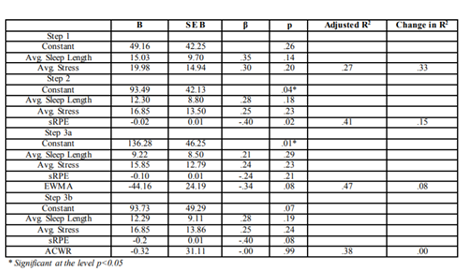
A hierarchical regression was performed to examine the possibility of wellness, sRPE and the ACWR or EWMA to predict injury risk as demonstrated by AST scores. Given that average sleep length and average stress were the only wellness markers to demonstrate any significant correlations with non-wellness variables, they were the markers selected for regression analysis (see Table3).
Significance was only achieved for the constant as an individual predictor within the model within Step 2 (B = 93.49, p < 0.05) and Step 3a (B = 136.28, p < 0.05). The prediction model that included the EWMA explained the greatest amount of variance in population AST scores (R2 = 0.47). Conversely, the ACWR explained less variance (R2 = 0.37) than the model that utilised only wellness and sRPE (R2 = 0.41).
4. Discussion
This study investigated the relationship between workloads and injury risk in intercollegiate female athletes and the capacity of workload indexes to predict such risk. The results of this investigation demonstrate a significant relationship between AST scores, which have been shown to be associated with injury risk [18], and EWMA values (r = -0.61, p< 0.01). There was no significant relationship detected between ACWR values and AST scores (r = - 0.38, p< 0.05). Furthermore, an injury risk prediction model utilising the EWMA showed a greater ability to predict injury risk (R2 = 0.47) than a model utilising the ACWR (R2 = 0.37). It can be concluded that coaches monitoring acute and chronic training loads should make use of the EWMA as opposed to the ACWR.
A moderate negative correlation was observed between the EWMA and the AST (r = -0.61, p< 0.01). Previous research has shown that hip adductor strength losses can precede the onset of pain and injury [18]. A study by O’Connor [29] determined eight key risk factors that contributed to groin injury in professional rugby league players, one of which was the peak torque of the non-dominant limb during adduction with rotation at 0.52 rad.s-1. If increasing EWMA values share a relationship with decreasing AST scores, then it may be the case that increasing EWMA values share a relationship with increased groin injury risk. In contrast, the ACWR model did not exhibit a strong relationship with AST scores in our study (r = -0.38, p>0.05). This is indicative of the possibility that the EWMA is a more valid index with which to monitor injury risk than the ACWR, which is in agreement with previous research [9].
While other research has demonstrated the relationship between the original ACWR index and injury risk [1, 11, 15] in elite male athletes, more recent literature has demonstrated that the EWMA index may have a stronger relationship with injury risk [9, 10]. The same result was obtained in our study, whereby the prediction model that used the EWMA explained a greater degree of variance in injury risk than that which used the ACWR (47% and 38% of the variance in injury risk respectively). This is most likely due to the decaying nature of fitness and fatigue, which is accounted for by the EWMA. The prediction model was in fact weakened by the addition of the ACWR in comparison to using sRPE and wellness markers alone (38% and 41% of the variance in injury risk respectively). Not only does the EWMA appear to be a stronger predictor of injury risk than the ACWR, it is a useful addition to the training load monitoring tools of a practitioner according to this study. Conversely, the data in this study suggests that utilising an ACWR based on rolling averages may not be of any additional use to practitioners when monitoring training load.
This decay of both fitness and fatigue is a core aspect of the fitness-fatigue theory [2, 3]. Within the design of the EWMA is a “time-decay constant”, which deteriorates the magnitude of input a value has as more subsequent values are added to the equation [9, 10]. In other words, the equation reduces the predicted impact of a training session as time passes. When one simply applies rolling averages, this is not the case. The fitness-fatigue theory describes both fitness and fatigue as being derived from one exercise stimulus, both of which will decay over time [2, 3]. As the EWMA applies a rate of decay to the exercise stimulus, or input, while rolling averages does not, it is logical that an ACWR calculated utilising the EWMA would be more effective at predicting injury risk than an ACWR calculated utilising rolling averages, as was seen in this study.
This study had several limitations, including small sample size (N=4). Studies examining the relationship between an iteration of the ACWR and injury risk typically use larger sample sizes, for instance 32 elite youth football players [11], or 59 elite Australian football players [9]. The smaller sample size in the present study significantly lowered the statistical power of any tests performed on the data that was obtained [30]. The study duration was also a limitation because it limited the number of trials that could be performed, thus reducing the amount of data for analysis. Previous research that examined the use of an ACWR to detect injury risk employed durations of two years [9, 15], six years [12] or one year [13]. The shorter timeframe is impractical for the monitoring of injury incidence, so tests associated with injury risk, such as the AST [18] were included. Control over participant’s in this study was a limitation as recreational athletes were used in this study, with whom compliance can be an issue.
5. Conclusion
The results of this investigation demonstrate that the EWMA is more useful for interpreting an athlete’s risk of injury than the ACWR. The injury prediction model utilising wellness scores, sRPE loads and the EWMA explained more of the variance in AST scores (R2 = 0.47) than the same model that contained the ACWR (R2 = 0.37). Given the previously demonstrated association between reduced hip adductor strength and increased groin injury risk [18,29], it can be concluded that sports science and strength and conditioning professionals should utilise the EWMA workload index as opposed to the ACWR model. Furthermore, the injury prediction model that utilised wellness and sRPE only (R2 = 0.41) did not predict as much variance in the AST scores as the model that included the EWMA. This suggests that monitoring an EWMA index of workload is more beneficial to monitoring injury risk in athletes than simply monitoring absolute workload values. Coaches should make use of the EWMA workload index to monitor injury risk based on workload progression as opposed to the original ACWR model and this should be done in conjunction with monitoring absolute workloads.
References
- Hulin, B.T., Gabbett, T.J., La wson, D.W., Caputi, P. and Sa mpson, J.A., The acute:chronic workload ratio predicts inju ry: high chronic workload may decrease inju ry risk in elite rugby league players, British Journal of Sports Medicine. 50(4): 231-236, (2015).
- Chiu, L. and Barnes, J., The fitness -fatigue model rev isited: implications for p lanning short- and long-term tra ining. Strength and Conditioning Journal, 25(6): 42-51, (2003).
- Zatsiorsky, V. and Krae mer, W., Science and practice of strength training. 2nd ed. Champaign, Ill.: Human Kinetics, (2006).
- Gabbett, T.J. and Jenkins, D.G, Re lationship between training load and inju ry in professional rugby league players. Journal of Sc ience and Medicine in Sport, 14: 204-209, (2011).
- Anderson, L., Trip lett-McBride, T., Foster, C., Doberstein, S. and Brice, G. Impact of t rain ing patterns on incidence of illness and injury during a wo men’s collegiate basketball season. Journal of Strength and Conditioning Research. 17(4): 734-738, (2003).
- Gabbett, T.J., The tra ining-injury prevention paradox: should athletes be training smarter and harder. Brit ish Journal of Sports Medicine. 50(5): 273-280, (2016).
- Gabbett, T., Kennelly, S., Sheehan, J., Hawkins, R., M ilsom, J., King, E., Whiteley, R. and Ekstrand, J., If overuse injury is a ‘train ing load error’, should undertraining be viewed the same way?. British Journal of Sports Medicine. 50(17): 1017-1018, (2016).
- Gabbett, T.J., Hu lin, B.T., Blanch, P. and Whiteley, R., High training workloads alone do not cause sports injuries: how you get there is the real issue. Brit ish Journal of Sports Medicine. 50(8): 444-445, (2016).
- Murray, N.B., Gabbett, T.J., Townshend, A.D. and Blanch, P., Ca lculating acute:chronic workload rat ios using exponentially weighted moving averages provides a mo re sensitive indicator of injury likelihood than rolling averages. British Journal of Sports Medicine. 51(9): 749-754, (2016).
- Mensaspa, P., Are rolling averages a good way to assess training load for injury prevention?. British Journal of Sports Medicine. 51(7): 618- 619, (2016).
- Bowen, L., Gross, A.S., Gimpe l, M. and Li, F.X., Accumu lated workloads and the acute:chronic workload ratio re late to injury risk in elite youth football players. British Journal of Sports Medicine. 51(5): 452 -459, (2016).
- Hulin, B.T., Gabbett, T.J., Blanch, P., Chap man, P., Bailey, D. and Orchard, J.W., Spikes in acute workload are associated with increased injury risk in elite cric ket fast bowlers. British Journal of Sports Medicine. 48(8): 708-712, (2013).
- Malone, S., Owen, A., Ne wton, M., Mendes, B., Collins, K. and Gabbett, T., The acute:chonic workload rat io in re lation to injury risk in professional soccer. Journal of Science and Medicine in Sport. 20(6): 561-565, (2017).
- Malone, S., Roe, M ., Doran, D., Gabbett, T. and Collins, K., High chronic tra ining loads and e xposure to bouts of ma ximal veloc ity running reduce injury risk in e lite Gae lic football. Journal of Sc ience and Medic ine in Sport. 20(3): 250-254, (2017).
- Murray, N.B., Gabbett, T.J., Townshend, A.D., Hulin, B.T. and McLe llan, C.P., Indiv idual and combined e ffects of acute and chronic running loads on injury risk in e lite Australian footballers. Scandinavian Journal of Medicine and Science in Sports . 27(9): 990-998, (2016).
- Gabbett, T.J. and Do mro w, N., Re lationships between training load, injury and fitness in sub - elite co llision sport athletes. Journal of Sports Sciences. 25(13): 1507-1519, (2007).
- McLean, B.D., Coutts, A.J., Kelly, V., McGu igan, M.R. and Cormack, S.J., Neuro muscular, endocrine and perceptual fatigue responses during diffe rent length between-match mic rocycles in professional rugby league players. International Journal of Sports Physiology and Performance. 5(3): 367- 383, (2010).
- Malliaras, P., Hogan, A., Na wrocki, A., Crossley, K. and Schache, A., Hip fle xib ility and strength measures: reliability and association with athletic groin pain. British Journal of Sports Medicine. 43(10): 739-744, (2009).
- von Rosen, P., Froh m, A., Kottorp, A., Friden,C. and He ijne, A., Mult iple factors exp lain injury risk in adolescent elite athletes: Applying a biopsychosocial perspective. Scandinavian Journal of Medic ine & Sc ience in Sports . 27(12): 2059-2069, (2017).
- Mile wski, M., Skaggs, D., Bishop, G., Pace, J., Ibrahim, D., Wren, T. and Barzdukas, A., Chronic lack of sleep is associated with increased sports injuries in adolescent athletes. Journal of Pediatric Orthopaedics . 34(2): 129-133, (2014).
- Nippert, A.H. and Smith, A.M., Psychologic stress related to injury and impact on sport performance. Physical Medicine and Rehabilitation Clinics of North A merica. 19: 399-418, (2008).
- Ivarsson, A., Johnson, U. and Podlog, L., Psychological Pred ictors of Injury Occurrence: A Prospective Investigation of Professional Swedish Soccer Players. Journal of Sport Rehabilitation. 22(1): 19-26, (2013).
- Gallo, T.F., Cormack, S.J., Gabbett, T.J. and Loren zen, C.H., Pre-tra ining perce ived wellness impacts training output in Australian football p layers. Journal of Sports Sc iences . 34(15): 1445-1451, (2016).
- Delahunt, E., Mc Entee, B.L., Kennelly, C., Green, B.S. and Coughlan, G.F., Intrarater reliability of the adductor squeeze test in gaelic games athletes. Journal of Athletic Tra ining. 46(3): 241-245, (2011).
- Kellmann, M., Preventing overtraining in athletes in high-intensity sports and stress/recovery monitoring. Scandinavian Journal of Medicine & Sc ience in Sports . 20: 95-102, (2010).
- Paschalis, V., Koutedakis, Y., Ja murtas, A.Z., Mougios, V. and Balt zopoulos, V., Equal volumes of high and low intensity eccentric e xerc ise in relation to muscle damage and performance. Journal of Strength and Conditioning Research. 19(1): 184-188, (2005).
- Gastin, P.B., Meyer, D. and Rob inson, D., Perceptions of wellness to monitor adaptive responses to training and competition in e lite Australian football. Journal of Strength and Conditioning Research. 27(9): 2518-2526, (2013).
- Foster, C., Monitoring tra ining in athletes with reference to overtrain ing syndrome. Medicine and Science in Sports and Exe rcise. 30(7): 1164-1168, (1998).
- O’Connor, D.M., Gro in injuries in professional rugby league players: a prospective study. Journal of Sports Sciences . 22(7): 629-636, (2004).
- Wilson Van Voorh is, C.R. and Morgan, B.L., Understanding power and ru les of thumb for determining sa mple sizes. Tutoria ls in Quantitative Methods for Psychology. 3(2): 43 - 50, (2007).