


|
|
DOI Prefix 10.20431 |
Information
Journal Policies
Blood Lactate and Substrate use Changes during Arm Crank Ergometry (ACE) and Functional Electrical Stimulation Cycling (FES) Training in Persons with Spinal Cord Injury
Christopher R.Harnish1*,Jonathan A.Daniels2*
2.Arizona State University School of Medicine, Tucson, AZ 85724, USA.
Copyright : © 2018 Authors. This is an open-access article distributed under the terms of the Creative Commons Attribution License, which permits unrestricted use, distribution, and reproduction in any medium, provided the original author and source are credited.
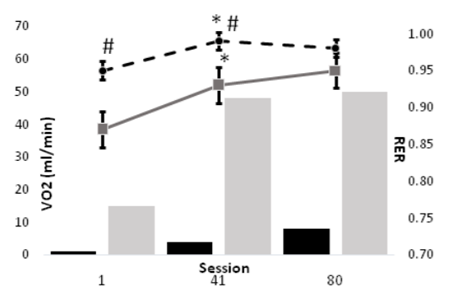
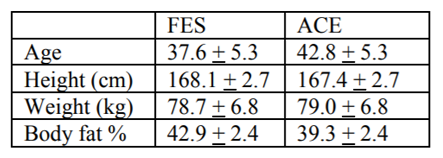
The purpose of this investigation were to compare the training responses to 60 min of Arm crank ergometry (ACE) or functional electrical stimulation cycling (FES) in persons with spinal cord injury (SCI). Methods: 12 motor complete SCI persons, T1 – T10 were randomized into either ACE (4 men, 2 women) or FES (4 men, 2 women) intervention and performed a VO2 Peaktest, and % body fat (%BF) determined via DXA prior to training. Subjects exercised 60 min, 5 d/wk for 16 wk using ACE or FES. Heart rate (HR) was continuously monitored and VO2 during sessions 1 and 80, while 5 μl blood lactate concentration (BLC) was measured from the earlobe at 0, 10, 20, 30, 40 min. significance level set at 0.05 and all data expressed as mean (± SE). Results: There were no group differences prior to training – Age 37.8 ± 2.7 yo, Hgt 171.5 ± 2.8 cm, Wgt 80.8 ± 5.2 kg, VO2 Peak15.2 ± 1.0 ml/kg/min, and %BF 40.8 ± 1.6. Session 1 data indicated FES BLC (4.1 ± 0.6 vs 2.5 ± 0.7 mM) and RER (0.89 ± 0.04 vs 0.96 ± 0.03) were consistently, but not significantly higher than FES, while VO2(436 ± 64 vs 595 ± 78 ml/kg/min) and HR (82 ± 5 vs 108 ± 6 bpm) were lower; only HR was significant (p< 0.05). Following training, a similar pattern in data, with both VO2and HR significantly lower in FES (p< 0.05), while RER and BLC were again higher, but not significant. Conclusions: ACE elicits a stronger cardiovascular stress in SCI, but FES produces higher BLC, suggesting a localized response to FES. These data may elucidate the exercise response and metabolic implications to better prescribe training in persons with SCI.
Spinal cord injury, functional electrical stimulation, cycling, arm crank ergometry, exercise ,Research in Sports Medicine
More than 6 million persons in the U.S. live with spinal cord injury (SCI) [1]. SCI compromises functional ability and long-term health, with as many as 70% of SCI exhibiting two or more components of Metabolic Syndrome [2-6], including obesity and blood sugar management. While exercise is an effective treatment for metabolic syndrome (MtS), the types of exercise available to SCI are often limited in scope and application, reducing the real impact exercise can have on often cited outcomes. Commonly, arm crank ergometry or lower extremity functional electrical stimulation (FES) are used for SCI. However, the training outcomes for these two measures can vary widely, however.
It has been shown [7,8] that upper extremity training is effective at improving central and peripheral fitness markers, and may transfer to lower extremity fitness, assuming intensity is high enough [8]. Most recently, Harnish et al. [9] demonstrated that a 12-wk arm crank ergometry (ACE) program consisting of high-intensity intervals can elicit dramatic improvement in maximal and submaximal performance measures in even high level individuals with SCI. In contrast to upper body exercise, FES training of the legs has both metabolic and performance consequences.
Despite its endurance nature, FES cycling provides a weak cardiovascular benefit, but has shown promising results restoring leg muscle mass [10,11] and enhancing metabolic parameters [12-14]. For example, Mohr et al.[14] showed that a year of FES significantly improved insulin sensitivity and GLUT-4, while more recently, Griffin et al. showed that just 10 weeks of FES cycling improved glucose tolerance tests and reduced inflammatory markers like IL-6 and CRP. While improvement in insulin sensitivity is typically associated with a reduction in adipose tissue, data indicate that FES elicits peripheral enhancement of glucose uptake. For instance, after a year of training, Mohr et al. [15] showed a reversal of Type II fibers; prior to training 63% of the muscle was Type IIx and 33% Type IIa, while at the completion of training the breakdown was 32% and 61%, respectively. Even more interesting were data by Crameri et al. [16] showing similar trends in as short as 10 weeks; Type IIa fibers increased from ~25% to nearly 80% by the end of training. These two papers suggest the profound impact FES may have metabolically, improving insulin sensitivity from a route typically unseen in the general population and has important implications for long-term management of SCI. Unfortunately, there have been few direct comparisons of direct or indirect fitness or metabolic measures in these two common modalities. Moreover, little is known about both the physiologic and metabolic (e.g., substrate use and lactate production) during these two modalities. The purpose of this investigation was to compare the physiologic responses over the course of 16-wk of ACE or FES in persons with SCI. We hypothesized that ACE training, conducted at much higher relative intensities, would result in a greater blood lactate levels during training, but also follow typical exercise adaptive changes over the course of 16-wk of training.
2. Methods
All experimental protocols were reviewed and approved by the Hunter Holmes McGuire Veterans Administration Medical Center (VAMC) institutional review board and comply with the Declaration of Helsinki. All participants were actively recruited through word of mouth, flyers and call lists, with individuals being both veterans visiting the VAMC and individuals living in the greater Richmond, Virginia (USA) Community. Subjects were enrolled in the study following completion of the McGuire IRB approved informed consent document. A detailed medical history and American College of Sports Medicine (ACSM) risk factor assessment was performed for all participants and each subject was reviewed by an SCI board-certified physician. Only individuals considered paraplegics (i.e., T1–L2) AIS (American Spinal Injury Association Classification)-A through D for 3 months or longer were considered for the study. Individuals classified as High Risk based on established ACSM criteria, persons with known orthopedic limitations, diabetes mellitus (fasting glucose > 126 or HgbA1c > 7.0), hypothyroidism, renal disease, uncontrolled autonomic dysreflexia, recent (within 3 months) deep vein thrombosis, or pressure ulcers > Stage II were excluded from participation. Twelve motor complete SCI persons (ASIA T1 – T10) took part in a 16-wk of either ACE (5 men, 1 women) or FES cycling (4 men, 2 women).
Prior to training each subject completed an ACE VO2 Peak testing using an electronically braked LODE Angio ergometer (Electro-Med Corporation, Flint, MI).A continuous 2 min test protocol was used with a cadence set at 60 rpm and an initial load set to allow for a work rate of 25 W. VO2 was measured continuously using a Parvo MedicsTrueOne® 2400 metabolic cart (Parvo Medics, Sandy, UT).
Subjects were separated in either the ACE or FES group. Each session lasted 60 min, 5 d/wk for 16-wk. In each group exercise sessions included a 10 min light warm-up and cool down period. ACE training was performance on a Monark881E Rehab Trainer (HCI Fitness, Langley, WA), and consisted of 40 min of continuous exercise at 70-80% of peak HR, as determined during the VOO2 Peak test. FES cycle training was performed on an Ergys 2 cycle (Therapeutic Alliances Inc., Fairborn, OH). HR was continuously monitored and stored during all training sessions (Polar Electro Inc., Lake Success, NY), while VO2 was measured using a Cosmed K4b 2 portable analyzer (Cosmed USA, Chicago, IL) during sessions 1 and 80, while a 5 μl blood lactate was measured in sessions 1, 41, and 80 using a Lactate Scout (EKF diagnostic sales GmbH, Barleben/Magdeburg) from the earlobe at 0, 10, 20, 30, 40 min.
Power output was calculated for both ACE and FES using the following equations (ACSM):
PowerErgys (W) = (KP * 1.61 * RPM) / 6.12
Data were analyzed using Jump 9.0 software (SAS Institute Inc., Cary, NC). All data are presented as means ± se. Repeated analyses were run with Jump statistical software and Tukey post-hoc analysis with significance level set at 0.05.
3. Results
All data were reviewed and normally distributed. Subjects were 37.8+2.7yo, 171.5+2.8 cm tall, and 80.9+5.2kg; table 1 summarizes the characteristics for each training group. Due to extreme deconditioning, only one of our FES subjects could complete the first session of training without manual (cranking) assistance as prescribed using the minimal 1/8 KP setting on the Ergys 2. All subjects were able to complete the prescribed training session by session 41. Power output during ACE was significantly higher (P < 0.05) FES during all training sessions. The results of this study indicate that the physiological responses to FES differ from those of ACE, but may diminish with training (Figure 1). However, the metabolic responses to training exercise during FES appear to be significant, and, unlike ACE, continued to improve throughout the study. For example, BLC increased significantly from session 1 to 41 for both FES and ACE, but not from session 41 to 80. However, whereas ACE power output failed to improve in the last 8 weeks of training, power output during FES cycling increased significantly from session 1 to 41, and again from session 41 to 80 (Figure 2). Moreover, as depicted in figures 3 and 4, neither BLC nor RER changed significantly for FES between sessions 41 and 80.
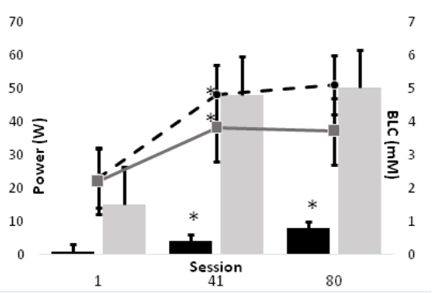
The purpose of this investigation was to compare the physiologic responses over the course of 16-wk of ACE or FES in persons with SCI. We hypothesized that ACE training would result in a greater metabolic stimulus, as measured by substrate use (RER) and blood lactate production. The major finding of the current study that BLC and RER were significantly higher during FES up to at least 8-wk into training, despite power output during exercise being ~10% that of ACE. Moreover, FES training continued to improve performance across the 16-wk training period, while ACE responses plateaued after just 8-wk.
Typically, endurance exercise results in significant whole body adaptation over the course of several weeks training. These changes include improved cardiovascular function and blood glucose management, as well as peripheral muscle adaptations, like increased reliance on aerobic energy production. Unfortunately, SCI are often limited in modalities of exercise for several reasons, including a lack of available facilities for training. This is especially true for FES cycling, which is often cost prohibitive. Nonetheless, FES is often used as major modality in research because the evidence indicates that despite its weak cardiovascular benefit, it has produced restoration of leg muscle mass [10,11] and enhancing metabolic parameters improved insulin sensitivity and GLUT-4 [14], and improved glucose tolerance tests and reduced inflammatory markers like IL-6 and CRP [12]. Even more intriguing are findings by Mohr et al. [15] showing12-mo of FES cycling resulted in a flipping of Type IIx and IIa fibers from 63% to 32% and 33% to 61%, respectively. Crameri and colleagues [16] saw an even more impressive change in just 10-wk, with IIa fiber % increasing from 25% to nearly 80%. The results of our study fall in line with these findings.
The major findings of the present study were that blood lactate and RER were typically much higher during FES than ACE up until at least 8-wk of training. In hindsight, this finding is less surprising than seems. First, ample evidence [15-17] has shown that paralyzed muscle transitions rapidly and predominantly to Type IIx fibers, which highly glycolytic and possess poor fatigue resistance. Thus, the BLC and RER data from the present study indicate that early in training our FES group relied heavily on these fibers, but by 8-wk their performance measures improved significantly; BLC and RER increased, but power output also increased 4-fold. This timeline of improvement matches Crameri and colleauges [16] 10-wk fiber transition. Even more important, our FES group continued to improve to 16-wk, whereas ACE performance plateaued. Specifically, BLC and RER remained nearly the same at 16-wk despite a doubling in power output from 4 W to 8 W. In contrast, ACE performance plateaued at ~50 W, also with no change in BLC or RER. In other words, ACE performance stagnated.
It is important to note that this was a relatively small study in comparison with many abled-body studies. Moreover, one major limitation in this study was the lack of a progressive and unvaried training program for either group. We believe this may have limited overall training progression. Future research would be wise to utilize a periodized training approach similar to one used in our recent interval training study . Nonetheless, these data serve an important marker for the development of future research projects for persons with SCI. Specifically, blood lactate can be used as relatively non-invasive and inexpensive measure to ascertain training efficacy during both ACE and FES training in SCI. In fact, BLC proved to be a definitive measure in identifying training improvements.
In conclusion, the results of this study indicate that the physiological responses to FES differ from those of ACE, but that those differences follow a predictable course of improvement after just 8-wk of training. Despite ACE being conducted at much higher relative exercise intensity, FES training tended to result in great lactate levels and reliance on carbohydrate early in training. However, FES continued to show significant improvement in work capacity with little or no change in BLC or RER; i.e., they showed well-established endurance training improvements. Moreover, the aforementioned improvements are indicative of previously reported fiber type conversions during FES.
References
- Christopher and Dana Reeve Foundation. One Degree of Separation: Paralysis and Spinal Cord Injury in the United States. http://www. christopherreeve.org/site/c.ddJFKRNoFiG/b.50 91685/k.58BD/One _ Degree_ of _ Separation. htm. Retrieved July 17, 2009.
- DeVivo MJ, Schechuk RM, Stover SL, Black KL, and Go BK. A cross-sectional study of the relationship between age and current health status for person with spinal cord injuries. Paraplegia. 30: 820-827, 1992.
- Gater DR. Obesity after spinal cord injury. Phys Med RehabilClin N Am. 18(2):333-351, vii, 2007.
- Gater DR. Spinal Cord Injury. In: Ehrman JK; Gordon PM, Visich PS, and Keteyian SJ (ed) Clinical Exercise Physiology, 2nd edn. Human Kinetics, Champaign, 2009.
- Lavela SL, Weaver FM, Goldstein B, et al. Diabetes mellitus in individuals with spinal cord injury or disorder. J Spinal Cord Med. 29(4):387-395, 2006.
- Wilt TJ, Carlson KF, Goldish GD, et al. Carbohydrate and lipid disorders and relevant considerations in persons with spinal cord injury. Evid Rep Technol Assess. 163:1-95, 2008.
- Rajan S, McNeely MJ, Warms C, and Goldstein B. Clinical assessment and management of obesity in individuals with spinal cord injury: a review. J Spinal Cord Med. 31(4):361-372, 2008.
- Tordi N, Belli A, Mougin F, Rouillon JD, and Gimenez M. Specific and transfer effects induced by arm or leg training. Int J Sports Med. 22(7):517-24, 2001.
- Harnish CR, JA Daniels, and D. Caruso. Training response to high-intensity interval training in a 42-year-old man with chronic spinal cord injury. J Spinal Cord Med. 40 (2): 246-249, 2017.
- Dudley GA, Castro MJ, Rogers S, Apple DF, Jr. A simple means of increasing muscle size after spinal cord injury: a pilot study. Eur J ApplPhysiolOccup Physiol. Sep 1999; 80(4): 394-396.
- Mahoney ET, Bickel CS, Elder C, et al. Changes in skeletal muscle size and glucose tolerance with electrically stimulated resistance training in subjects with chronic spinal cord injury. Arch Phys Med Rehabil. Jul 2005;86(7):1502-1504.
- Griffin L, Decker MJ, Hwang JY, et al. Functional electrical stimulation cycling improves body composition, metabolic and neural factors in persons with spinal cord injury. J ElectromyogrKinesiol. Aug 2009; 19(4):614-622.
- Jeon JY, Weiss CB, Steadward RD, et al. Improved glucose tolerance and insulin sensitivity after electrical stimulation-assisted cycling in people with spinal cord injury. Spinal Cord. Mar 2002; 40(3):110-117.
- Mohr T, Dela F, Handberg A, Biering-Sorensen F, Galbo H, Kjaer M. Insulin action and long-term electrically induced training in individuals with spinal cord injuries. Med Sci Sports Exerc. Aug 2001; 33(8):1247-1252.
- Mohr T, Andersen JL, Biering-Sorensen F, et al. Long-term adaptation to electrically induced cycle training in severe spinal cord injured individuals. Spinal Cord. Jan 1997;35(1):1-16.
- Crameri RM, Weston A, Climstein M, Davis GM, Sutton JR. Effects of electrical stimulation-induced leg training on skeletal muscle adaptability in spinal cord injury. Scand J Med Sci Sports. Oct 2002; 12(5):316-322.
- Biering-Sorensen B, Kristensen IB, Kjaer M, Biering-Sorensen F. Muscle after spinal cord injury. Muscle Nerve. Oct 2009;40(4):499-519.