


|
|
DOI Prefix 10.20431 |
Information
Journal Policies
Physical, Performance, and Functional Movement Characteristics of NCAA Division III Women's Soccer and Volleyball Players
Christopher R.Harnish1*,Garrett Bullock2,Sarah Hendrix3,Jordyn Baumann4
2.Mountain River Physical Therapy, Chatham, VA USA.
3.Department of Athletic Training, Bridgewater College, Bridgewater, VA USA.
4.Department of Health and Human Performance, Ferrum College, Ferrum, VA USA.
Copyright :© 2017 Authors. This is an open-access article distributed under the terms of the Creative Commons Attribution License, which permits unrestricted use, distribution, and reproduction in any medium, provided the original author and source are credited.
Purpose: To characterize the physical attributes, performance measures, and FMS scores of a cohort of D3 women’s soccer and volleyball players across the 2016-2017 athletic school year.
Methods: 17 SOC (18.9+0.3 yo) and 13 VB (19.3+ 0.4 yo) players consented to the study and injury history was obtained before the season and then after. Athletes then performed pre-season FMS, a 3-site % body fat (%BF) skin fold analysis, and performance testing. Performance testing included Vertical Jump (VJ) test, Illinois Agility (IA) test, and 12x 20 m repeated sprint test (RST) with 20 sec recovery each sprint. FMS testing and 3-site % body fat (%BF) skin fold analysis were performed 1-wk prior to in-season, twice in-season, and 1-wk post season. A repeated measures ANOVA was run to compare differences between sports at each time point of the study. Spearman correlations were run to examine the relationships between the FMS and performance measures. All data are reported as means + SD, and all significance levels were set at α=0.05.
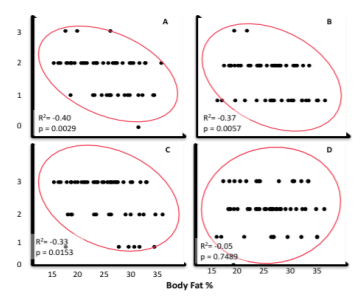
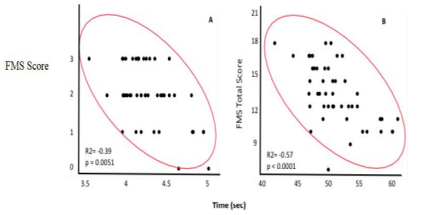
Results: Players were of similar height but VB players weighed (76.5 + 2.1 kg) significantly (p< 0.0001) more than SOC (63.0 + 1.9 kg). %BF was significantly higher (p=0.0022) for VB (28.6 + 1.4% vs 22.2 + 1.3%), which resulted 5.8 kg greater fat free mass (FFM) for VB (p=0.0001). There were no significant differences in any of the performance measures, however, the estimated power output for the VJ was significantly higher (p< 0.0001) for VB (3888.1 + 105.8 W) than SOC (3094.6 + 92.6 W). Pre-season FMS showed that S players scored significantly higher (Tukey p < 0.05) in Squat (Sq) 1.7 + 0.2 vs 1.2 + 0.2, Hurdle (Hd) 1.8 + 0.2 vs 1.1 + 0.18, and leg raise (ASLR) 2.59 + 0.14 vs 1.8 + 0.16 scores, but lower in Lunge (Ln) 1.4 + 0.2 vs 2.1 + 0.2 and Push-up (PU) 1.3 + 0.1 vs 1.9 + 0.2. Total scores (S 12.9 + 0.6 vs V 12.3 + 0.6) did not differ. After 4-wk, S improved (p < 0.05) Ln 2.4 + 0.2, PU 2.2 + 0.1, and Total scores 15.5 + 0.5, while V scores failed to improve. %BF appears to negatively impact FMS squat (R2=-0.40, p=0.0029), hurdle (R2=-0.37, p=0.0057), and inline lunge (R2=-0.33, p=0.0153), but not total FMS scores (R2=-0.22, p=0.1108).
Conclusion: There appears to be significant disparities in FMS scores among D3 women but little difference in performance measures. The negative relationship between %BF and lower FMS scores supports prior research that increased BF limits movement quality and increases risk for injury.
Division III, FMS, NCAA women, functional movement screen, performance,Research in Sports Medicine
The National Collegiate Athletic Association (NCAA) reports that more than 194,000 student athletes participated in Division III athletics in 2016-2017, which accounts for nearly 40% of all NCAA athletes. [1] While women make up about 40% of the Division III (D3) athletic population, the account for more than half of all reported injuries; [2] 55% of all injuries among women soccer and volleyball players were lower extremity. [3,4] However, while injury data for D3 athletes is relatively common, physical and performance norms are lacking. During the competitive season, coaches often aim for achieving peak performance.
Unfortunately, athletes often achieve high-level performances utilizing dys functional movement patterns that can increase an athlete’s injury risk. Functional, symmetric movement, a balance between optimal mobility and stability while performance fundamental movement patterns, may be critical to both reducing injury risk,[5,6] and possibly influencing performance of sports-related skills.[7,8]While it seems plausible that deficits in strength, mobility, or motor control could adversely impact performance, data are scarce for D3 athletes regarding physical characteristics, skill-related performance, or functional movement patterns.
The functional movement screen (FMS) is a valid and reliable tool for assessing fundamental movement patterns.[5,6] Therefore, the purposes of this study were to characterize the physical attributes, performance measures, and FMS scores of a cohort of D3 women’s soccer and volleyball players across the 2016-2017 athletic school year. We hypothesized that higher body fat levels would relate to lower FMS scores, and that lower FMS scores would relate to lower performance measures. We also expected to see significant differences in physical and performance characteristics between soccer and volleyball players.
2. Materials And Methods
All testing procedures were reviewed and approved by the Ferrum College IRB prior to all recruitment and data collection, and each participant received instructions on the study and signed informed consent documents. All recruits were active participants in the 2017 NCAA D3 athletic season. Seventeen soccer (SOC) (18.9+0.3 yo) and 13 volleyball (VB) (19.3+ 0.4 yo) players completed informed consent and were enrolled. Injury history was obtained before and after the season using proxy submission from the athletic training staff at Ferrum College. All testing was completed 1-week prior to the season (PRE), 5 weeks into the season (MID) – FMS only, and within 1-week after the season (POST).
FMS testing was completed as described in the FMS manual by trained technicians.[9] Administration was done using the same provided script in the manual. The screen was performed before any warm-up exercise and with brief familiarization of the protocol. The seven movements included the overhead squat, hurdle step, lunge, shoulder mobility, active straight leg raise, push-up, and rotary stability. Each movement was scored as 3, 2, 1, or 0. A score of 3 indicates that the movement was completed both pain-free and without compensation. A score of 2 indicates that the movement was completed pain-free but with some level of compensation or aid, and a score of 1 indicates that the client could not perform the movement. A score of 0 was only assigned to a movement that induced pain. Because of the relationship between neuromuscular asymmetry and injury risk, the FMS scoring system highlights asymmetry and takes the lowest score of 2 as the overall score for that movement. For example, an active straight leg raise score of 3/3 on the left leg and 2/3 on the right gives an overall score of 2/3 on the active straight leg raise movement. The FMS was the only evaluation completed during the MID time period[9].
A 3-site body fat skinfold analysis was typically completed after the FMS. Skinfold analysis was completed as outlined in the ACSM Guidelines (2017) and all skinfold measurements were taken by the same skilled technician (CRH); body density was calculated from the tricep, suprailiac, and thigh sites, while body fat was estimated using the Siri equation.[10]
Performance testing was completed 1-wk prior to in-season (PRE) and 1-wk post season. Testing included a standard best of three trial vertical jump (VJ) test[11] using a Vertec (Jump USA, Sunnyvale, CA), a best of three trial Illinois Agility test (IAT),[12] and 12 X 20 m repeated sprint test (RST) with 20 sec recovery each sprint.[13] For the RST, subjects will be given an audible alarm to signal each sprint, with timing beginning at the alarm and ending after the athlete crosses the line. Both IAT and RST were timed by the same researcher (CRH) using a standard stop watch. To optimize motivation and effort, athletes were paired during the RST. Average power (W) for VJ was calculated using the Lewis Formula as described by Harman et al. (1988)[14] and as follows:
Avg. power (W) = 21.2 (jump height (cm)) + 23.0 (body mass (kg))-1,393
3. Statistical Analyses
Data were analyzed using Jump 13.0 software (SAS Institute Inc., Cary, NC). All data are presented as means ± SD. A repeated measures ANOVA was run to compare differences between sports at each time point of the study. Spearman correlations were run to examine the relationships between the FMS and performance measures.
4. Results
All data were reviewed and normally distributed. Table1 summarizes subject characteristics and FMS data for each test period. VB players were significantly heavier with a higher %BF PRE and POST season, and there was a non-significant trend toward higher %BF across the season.
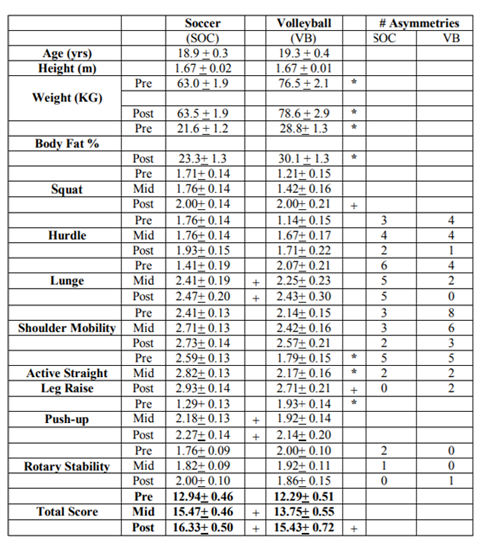
SOC demonstrated significantly better active straight leg raise (ASLR) scores at pre and mid-season than VB. Overall, FMS scores trended upward across the season, with SOC significantly improving lunge and push-up scores, while VB significantly improved squat and ASLR scores by the end of the season. Both group’s total score improved by post-season testing. There appears to be an inverse relationship between %BF and the squat, hurdle, and ASLR tests, suggesting the increased body fat influences movement quality (Figure 1). %BF did not correlate with total FMS scores (R2=-0.22, p=0.1108). Right-Left asymmetries did not appear to relate to FMS score trends.
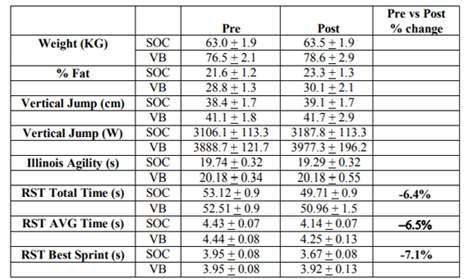
PRE and POST testing results are summarized in table 2. Vertical jump (cm) did not differ between SOC and VB, but estimated VJ power Output was significantly higher for VB at both test periods. There were no other differences between SOC and VB at either time point.
*Denotes significant difference between Soccer (SOC) and Volleyball (VB) at p <0.05. Pre vs post changes denoted by % change at p <0.05.
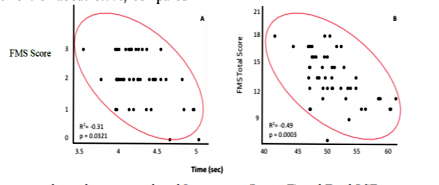
Only SOC showed improvement in any performance test from pre to post season. Total, average, and best sprint times during the RST all improved significantly for SOC, with an overall improvement of about 6.7%, compared to 2.7% for VB. Spearman correlations indicate that both Lunge and Total FMS scores were moderately related to Total, AVG and Best RST performance (Figures 2-4).
Squat was inversely related to AVG (R2 = - 0.33, p=0.0281) and Best RST (R2= -0.42, p=0.0029), while ASLR was inversely related to AVG RST (R2= -0.31, 0.0276). No other relationships were observed.

To our knowledge, this is the first study to clearly define physical, performance, and FMS characteristics for contemporary D3 women SOC and VB players. The main purpose of this study was to characterize the physical attributes, performance, and FMS scores for a cohort of D3 women’s soccer and volleyball players. In our cohort of D3 women athletes, there was little differentiation between athletes in common skill-related performance measures, despite significant differences in %BF and body mass. The inverse relationship between %BF and lower FMS scores in some tests suggests that reducing body fat could improve performance measures. Furthermore, the FMS may be useful in identifying potential skill-related performance decrements in similar athletes.
The major findings of this study were that there appear to be few distinguishing characteristics between SOC and VB in this cohort. While both body mass and % BF were significantly higher for VB players, other performance measures including VJ, IAT, and RST results failed to differentiate between the two sports. It is worth noting, however, that average power for VJ was significantly higher for VB, actual VJ height was similar, likely owing to the fact that VB players were more than 13 kg heavier. Across the season, SOC showed a significant improvement in RST times from PRE to POST, likely related to the greater sport-specific demands of the sport.
These sport data do, however, differ from values reported for higher level (e.g., elite national, D1, etc…) players. For example, VB players is this study had more than double that reported by Maly et al. [15] for national level players. More interesting, however, is that this cohort performed similar to a group of early teen female VB players.[16]Our SOC group also showed large disparities in performance compared to D1 players; IAT times were nearly double, while VJ height was 14 cm lower.[17] The obvious conclusion is that these differences highlight some of the requisite abilities needed to perform at higher levels. However, it also underscores the opportunity for better conditioning programs for D3 athletes. For example, after accounting for the higher %BF in our VB players, they still had a significantly higher fat free mass, indicating that significant improvements in VJ could be obtained through even small reductions in body fat.
Another interesting finding, perhaps owing to the lack of performance distinction between sports, there were few differences in FMS scores either. In fact, only the active straight leg raise (ASLR) and push-up showed any differences; SOC players demonstrated higher scores at PRE and MID, but not at POST testing, while VB scored higher on the push-up at PRE. There were no differences in the FMS total score for any time period. One interesting finding, however, was that both athlete groups saw low individual FMS tests improve by the MID or POST test period. These findings are similar to those reported by Sprague et al. [18] in D2 women SOC and VB players. For instance, they too saw improvements in squat and in-line lunge scores, as well as total scores on par with our results. They also reported reductions in the number of asymmetries. It has been surmised that that asymmetries predispose athletes to injury,[19]thus reductions in asymmetries and improvement in total scores indicate that participation in sport may itself improve overall functional movement patterns. Moreover, our data enhances the suggestion that movement patterns influence performance measures.
Among our data, we noted that RST inversely related to inline lunge scores. These findings are in contrast to previous studies in which the inline lunge was not observed to have a relationship to sprint velocity.[7,20,21]These observations may be disparate due to the specific sprint testing that was utilized between studies. Hartigan et al. [21] assessed maximum 36.6 meter sprint time, Lockie et al. [20] measured maximum multidirectional speed and jumping, and Lockie et al. [7] measured maximal 20 meter sprint time and change of direction speed. However, this study assessed anaerobic repeated sprint performance.[13]The inline lunge requires single leg stance and reciprocal hip control within a closed kinetic-chain position.[22]Furthermore, the inline lunge tests evaluates the ability to decelerate and single leg stance efficiency.[9] As a result, the inline lunge test may assess an athlete’s efficiency during sprinting compared to overall sprint velocity.
Prior research also suggested that body fat negatively influences FMS test scores.[23] While we failed to note a link between %BF and total score (R2=-0.22, p=0.1108), there was a significant inverse relationship between the squat, hurdle step, and ASLR tests, suggesting that increased body fat alters mobility, but not to overall FMS scores, only partly supporting earlier research in D2 athletes. [6] There were limitations to this study. This exploratory analysis had a relatively small sample size. There is currently a paucity of D3 reported athletic performance data. Thus, while this investigation reports the performance and resiliency of these D3 athletes, further research with higher power is necessary to better comprehend women’s D3 athletic performance. Furthermore, due to NCAA D3 regulations, [24] strength and conditioning and other forms of extracurricular training are voluntary. As a result, while practice and games are mandatory, the heterogeneity in training strategies does not allow to fully control and quantify each individual’s total training load and the effects this has on physical attributes and performance.
6. Conclusion
In conclusion, among D3 women soccer and volleyball players, the FMS may be a useful tool for identifying movement pattern issues and potentially minimizing possible injury risk. Our data also suggest, that among some D3 athletes, there is a considerable gap in performance between even some youth level players, and that both soccer and volleyball players have significantly higher body fat levels. Higher % BF appears to reduce the quality of movement patterns and both may relate to the lower performance indices seen. While it must be noted that the obvious limitation of this study is the relatively narrow sample population, making definitive conclusions difficult. The overarching recommendation, however, is that there is a clear need for improved conditioning programs at the D3 level.
References
- NCAA. (2017, December 14, 2017). Division III 2017-2018 Facts and Figures. Available: http://www.ncaa.org/sites/default/files/2018DIII_F actsandFigures_20170906.pdf
- SallisR. E., Jones K., Sunshine S., Smith G., and Simon L., Comparing sports injuries in men and women,Int J Sports Med, vol. 22, no. 6, pp. 420-3 (2001).
- Hootman J.M., Dick R., and Agel J., Epidemiology of collegiate injuries for 15 sports: summary and recommendations for injury prevention initiatives,J Athl Train, vol. 42, no. 2, pp. 311-9 (2007).
- Agel J., Palmieri-Smith R.M., Dick R., Wojtys E.M., and Marshall S.W., Descriptive epidemiology of collegiate women's volleyball injuries: National Collegiate Athletic Association Injury Surveillance System, 1988-1989 through 2003-2004, J Athl Train, vol. 42, no. 2, pp. 295-302 (2007).
- Chorba R.S., Chorba D.J., Bouillon L.E., Overmyer C.A., and Landis J.A., Use of a functional movement screening tool to determine injury risk in female collegiate athletes,N Am J Sports Phys Ther, vol. 5, no. 2, pp. 47-54 (2010).
- Mokha M., Sprague P.A., and Gatens D.R., Predicting Musculoskeletal Injury in National Collegiate Athletic Association Division II Athletes From Asymmetries and Individual-Test Versus Composite Functional Movement Screen Scores,J Athl Train, vol. 51, no. 4, pp. 276-82 (2016).
- Lockie R.G., Schultz A.B., Jordan C.A., Callaghan S.J., Jeffriess M.D., and Luczo T.M., Can selected functional movement screen assessments be used to identify movement deficiencies that could affect multidirectional speed and jump performance?,J Strength Cond Res, vol. 29, no. 1, pp. 195-205 (2015).
- Silva B., Clemente F.M., Camoes M., and Bezerra P., Functional Movement Screen Scores and Physical Performance among Youth Elite Soccer Players,Sports, vol. 5, no. 1, p. 16 (2017).
- Cook G., Kiesel K., Rose G., Bryant M.F., Movement Lotus (2011).
- Esmat T.. (2016, December 14, 2017). Measuring and Evaluating Body Composition. American College of Sports Medicine. Available: http://www.acsm.org/publicinformation/articles/20 16/10/07/measuring-and-evaluating-body-composition
- Isaacs L.D., Comparison of the vertec and Just Jump Systems for measuring height of vertical jump by young children,Percept Mot Skills, vol. 86, no. 2, pp. 659-63, Apr 1998.
- Whitehead J.R. and Corbin C.B., Youth fitness testing: the effect of percentile-based evaluative feedback on intrinsic motivation, Res Q Exerc Sport, vol. 62, no. 2, pp. 225-31 (1991).
- Meckel Y., Machnai O., and Eliakim A., Relationship among repeated sprint tests, aerobic fitness, and anaerobic fitness in elite adolescent soccer players, J Strength Cond Res, vol. 23, no. 1, pp. 163-9 (2009).
- Harman E.A., Rosenstein M.T., Frykman P.N., Rosenstein R.M., Kraemer W.J., Estimation of Human Power Output from Maximal Vertical Jump and Body Mass,Defense Technical Infromation Center (1988).
- Maly T., Mala L., Zahalka F., Balas J., Cada M., Comparison of Body Composition Between Two Elite Women’s Volleyball Teams, Acta Universitatis Palackianae Olomucensis. Gymnica, vol. 41, no. 1 (2011).
- Paz G.A., Gabbett T.J., Maia M.F., Santana H., Miranda H., and Lima V., Physical performance and positional differences among young female volleyball players,J Sports Med Phys Fitness, vol. 57, no. 10, pp. 1282-1289 (2017).
- Vescovi J.D., Brown T.D., Murray T.M., Positional Characteristics of Physical Performance in Division I Collegiate Female Soccer Players,Journal of Sports Medicine and Physical Fitness, vol. 46, no. 2, p. 221 (2006).
- Sprague P.A., Mokha G.M., and Gatens D.R., Changes in functional movement screen scores over a season in collegiate soccer and volleyball athletes, J Strength Cond Res, vol. 28, no. 11, pp. 3155-63 (2014).
- Kiesel K.B., Butler R.J., and Plisky P.J., Prediction of injury by limited and asymmetrical fundamental movement patterns in american football players, J Sport Rehabil, vol. 23, no. 2, pp. 88-94 (2014).
- Lockie R., Schultz A., Callaghan S., Jordan C., Luczo T., and Jeffriess M., A preliminary investigation into the relationship between functional movement screen scores and athletic physical performance in female team sport athletes, Biol Sport, vol. 32, no. 1, pp. 41-51 (2015).
- Hartigan E.H., Lawrence M., Bisson B.M., Torgerson E., and Knight R.C., Relationship of the functional movement screen in-line lunge to power, speed, and balance measures, Sports Health, vol. 6, no. 3, pp. 197-202 (2014).
- Cook G.,Burton L., and Hoogenboom B., Pre-participation screening: the use of fundamental movements as an assessment of function - part 2,N Am J Sports Phys Ther, vol. 1, no. 3, pp. 132-9 (2006).
- Sprague P., Mokha G.M., Orris S., Gatens D.R.,Relationship Between Functional Movement Screen Score and Body Composition in NCAA Division II Athletes, Nova Southeastern University December 2, 2016, 2016.
- NCAA. (2016). NCAA Division III Compliance.Available:http://www.ncaa.org/co mpliance?division=d3