


|
|
DOI Prefix 10.20431 |
Information
Journal Policies
Cerebral Blood Flow in Dystonia Due to Pantothenate Kinase-Associated Neurodegeneration (PKAN) as Measured by Arterial Spin Labeling: A Pilot Study
Peter Stoeter1*, Pedro Roa Sanchez2, Herwin Speckter1, Jairo Oviedo1, Bernd Foerster1, Cesar F. Gonzalez1
2.Department of Neurology, CEDIMAT, Santo Domingo, Dominican Republic.
Copyright :© 2019 Authors. This is an open-access article distributed under the terms of the Creative Commons Attribution License, which permits unrestricted use, distribution, and reproduction in any medium, provided the original author and source are credited.
The rare condition of dystonia due to due to Pantothenate Kinase-Associated Neurodegeneration (PKAN)is characterized by a lesion of the globuspallidus, the "tiger’s eye". Cerebral Blood Flow (CBF) has not yet been examined by magnetic resonance imaging techniques because of the high disturbance of susceptibility in this area caused by iron deposits. The present pilot study was performed to demonstrate feasibility of CBF measurement by Arterial Spin Labeling (ASL) under these conditions.
In 4 PKAN patients and a group of 6 age-matched healthy controls, pseudo continuous ASL sequences were applied in two versions, one using gradient and one spin echo refocusing, and T2* time was measured as well.
In spite of the significant differences in T2* time of the globus pallidus between patients and controls, nearly identical CBF values were recorded by both ASL sequences, in both groups.
This pilot study showed for the first time that CBF appears to be normal in patients suffering from PKAN dystonia, including their basal ganglia, and that measurement of CBF using ASL can be applied successfully in areas of brain iron accumulation.
Pantothenate Kinase-Associated Neurodegeneration, Cerebral Blood Flow, Arterial Spin Labeling.
1. Introduction
Pantothenate Kinase-Associated Neurodegeneration (PKAN) is a genetically transmitted metabolic disorder belonging to the group of rare or orphan diseases with a general prevalence of about 1: 1,000,000 persons [1]. In the Dominican Republic, a rather large group of these patients has been identified, which is characterized by the same missense mutation of the PANK2 gene (c.680 A>G, p. Y227C) [2] and clinically by a delayed type of onset of symptoms during late infancy or early adolescence. Imaging studies have revealed the "eye-of-the-tiger" sign in most of these patients, whereas in some cases, the typical bright spot was found to be obscured by an excessive accumulation of iron in the globus pallidus [3, 4].
Accordingly, Quantitative Susceptibility Imaging (QSM) showed high disturbances of the local magnetic field in affected areas [5, 6], which might interfere severely with dynamic contrast perfusion studies. Thus, Cerebral Blood Flow has been measured by now only using Single Photon Emission Computed Tomography (SPECT) in two siblings affected by PKAN, who showed decreased perfusion of cortical areas and the basal ganglia [7].
However, a different technique of Magnetic Resonance Imaging (MRI) called Arterial Spin Labelling in its Pseudo Continuous variant (PCASL)is less susceptible to local field in homogeneities and has been applied successfully in Parkinson’s disease [8,9].
The present study was carried out to proof the feasibility of recording CBF by application of PCASL in brain areas of high iron concentration as well as to accumulate more data about CBF in PKAN dystonia.
2. Material And Methods
This prospective pilot study had been approved by the CEDIMAT Ethics Committee, and informed consent had been received from all participants.
Included were ASL data from 4 PKAN patients, three female and one male, of an age of 10, 11, 15 and 20 years with genetically proven homozygous mutation of the PANK 2 gene. In these patients, first symptoms had appeared between 8 and 15 years of age, and by time of MRI examination, had reached a score of 4, 8, 17 and 32 points on the Burke-Fahn-Marsden dystonia scale. Results were compared to 6 healthy volunteers, 4 female and 2 male, between 9 and 20 (mean 15.7) years old.
Imaging was carried out on a Philips 3 T Achieva scanner. Apart from routine T1- and T2-weighted sequence, MRI included two variations of PCASL, one using the more commonly applied gradient echo (FFE-EPI) sequence, and a second one using a spin echo (SE-EPI) sequence which due its refocusing pulse, is less susceptible to local field disturbances. The following parameters were applied in both sequences: 18 slices of a thickness of 6 mm and 6 mm spacing covering whole head, acquisition matrix 128x128, TR 4000 ms, flip angle 90° , label time 1650 msec. Post label delay was 1780 msec for FFE and 1400 msec for SE, TE was 14.0 msec for FFE and 23.6 msec for SE, and slice acquisition time was 47.7 msec for FFE and 80.0 msec for SE.
To measure T2* time, we used a 3D FFE sequence: 10 slices of 4 mm thickness covering the basal ganglia: TR 329 ms, TE 2.1 ms, flip angle 12°,10 echoes with 3.2 ms spacing. Here, pixel size was 1.3 x 1.3 mm.
Images were realigned with Statistical Parametric Mapping (SPM) 10 running under MATLAB andCBF was calculated using the ASL Data Processing Toolbox [10] which principally performs the subtraction of the labeled from the non-labeled control image and calculates CBF values according to the general kinetic model for quantitative perfusion [11]. Label efficiency was set to 0.85.
T2* maps were calculated with in-house software developed in Python (www.python. org). Data were fitted to a mono-exponential decay model using the Levenberg-Marquardt algorithm from the Scipy scientific libraries (www.scipy.org).
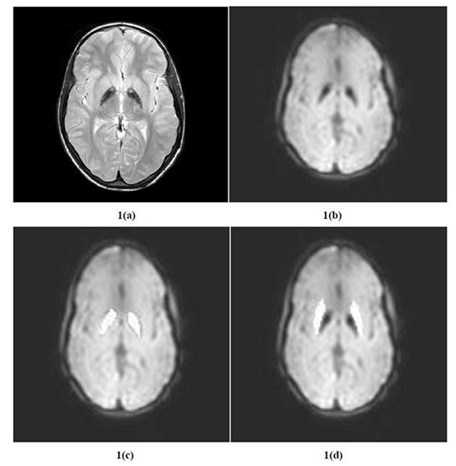
To measure CBF and T2* time, Regions of Interest (ROIs) were drawn individually on the means from the control images, covering the globus pallidus and putamen (Figure. 1). For grey matter measurements, ROIs were taken from the segmented means of the control images.
Results were compared between patients and controls by 2-tailed ttest and CBF of basal ganglia were correlated to T2* time measured in these areas.
3. Results
Whereas CBF maps could be calculated in controls from FFE and SE sequences in all six cases, this was possible in the patient group only in two cases, whereas in one patient, data from the FFE sequence and in the other one, data from the SE sequence had to be discarded because of movement artifacts. Thus, patients’ data were calculated from three different data sets only.
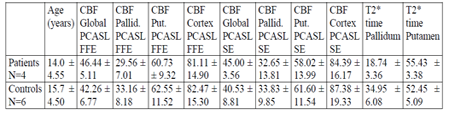
Comparison of CBF maps did not show any significant difference between patients and controls, neither when being measured by FFE nor by SE sequences: p>0.3 in all cases (see table 1). This applied as well to CBF of globus pallidus, which amounted to 29.56 (as measured by FFE) resp. 32.65 ml/sec/100g (as measured by SE) in patients and to 33.16 resp. 33.83 ml/sec/100g in volunteers, in spite of the significantly different T2* time, which -in correspondence to the presence of the "tiger’s eye" in all PCAN cases- was 18.74 ± 3.36 msec in patients and 34.95 ± 6.08 msec in healthy controls (p< 0.01). The relation of CBF measured from globus pallidus and from putamen was similar as well: 48.3% in patients vs. 53.5% in controls (FFE) and 54.63% in patients vs. 54.16% in controls (SE).
We did not see any significant difference between the CBF results obtained from measurements with FFE and from measurements with SE sequences over all participants, which applied to global flow (43.65 vs. 42.02 ml/sec/100g as measured by FFE and SE) as well as to CBF of globus pallidus (31.96 vs. 33.43 ml/sec/100g, p>0.4), and there was no close correlation between CBF of globus pallidus and its T2* time (Pearson’s CC=0.166 in CBF measured from FFE sequence and CC=-0.269 measured from SE sequence).
4. Discussion
The most important result of the present study as seen from the patients’ view is that they clearly showed a normal CBF in all measured areas, most notably also in their globus pallidus, as has been measured recently by Hetzer (2018) [12] in 14 normal male volunteers using as well PCASL. In PKAN, globus pallidus is severely affected, being the site of the primary lesion, and later by progressing accumulation of iron deposits. This combination of lesions has been described originally by Hallervorden and Spatz (1922) [13] later confirmed by pathological and imaging studies [14-16].
Our finding is in contrast to the above-mentioned SPECT study from Doi et al. (2010) [7], who reported decreased CBF "in the bilateral frontoparietal lobes, the globus pallidus, the striatum, and around the ventriculus quartus" in two siblings with a novel mutation of the PANK2 gene (Ile346Ser). Because of the different type of mutation and a different clinical course (adult onset and slow progression), the PanK2, the specific isoform of panthothenate kinase involved in PKAN and being localized to mitochondria, might have been affected in a different way in these siblings, with resulting different affection of the globus pallidus. This hypothesis however remains highly speculative because of the lack of further data concerning CBF in PKAN.
The other important finding of our study is the fact that PCASL clearly works in areas of iron accumulation and this technique is not influenced so much by the in homogeneity of a local magnetic field, neither in its FFE nor in its SE version. Very similar CBF values were recorded from the globus pallidus in spite of the significant difference in T2* relaxation between patients and controls. This is due to the fact that the CBF calculation is mainly based on the effect of the label pulse [17, 18]. Considering that the label and control images are affected equally by susceptibility provided sufficiently high signal-to-noise ratio, the subtraction of both images cancels the susceptibility effects.
The SE-EPI variant of the PCASL pulse sequence potentially is more robust with respect to artifacts in regions with high susceptibility which is an important consideration [19] for the choice of the most adequate acquisition technique.
5. Conclusion
This pilot study showed for the first time that CBF appears to be normal in patients suffering from PKAN dystonia, including their basal ganglia, and that measurement of CBF using PCASL can be applied successfully in areas of brain iron accumulation. Our results have to be confirmed by a prospective project including more patients and volunteers.
References
- Zhou, B; Westaway, SK; Levinson, B; Johnson, MA; Gitschier, J; Hayflick, SJ. A novel pantothenate kinase gene (PANK2) is defective in Hallervorden-Spatz syndrome. Nat Genet 2001; 28:345-349.
- Schiessl-Weyer J, Siegl C, Roa P, Laccone F, Tichy A, De Almeida Ribeiro E, Prohaska R, Stoeter P, Salzer U: Acanthocytosis and the c.680 A>G mutation in the PANK2gene: a study enrolling a cohort of PKAN patients from the Dominican Republic. PloS One. 2015; 10(4):e0125861. doi: 10.1371/journal. Pone. 0125861. eCollection 2015.
- Hayflick, SJ; Hartman, M; Coryell, J; Gitschier, J; Rowley H. Brain MRI in neurodegeneration with brain iron accumulation with and without PANK2 mutations. AJNR Am J Neuroradiol 2006; 27:1230-1233.
- Delgado, RF; Sanchez, PR; Speckter, H; Then, EP; Jimenez,R; Oviedo,J; Dellani, PR; Foerster, B; Stoeter, P.Missense PANK2 mutation without "Eye of the tiger" sign: MR findings in a large group of patients with pantothenate kinase-associated neurode generation (PKAN). J MagnReson Imaging 2012; 35:788-794
- Fermin-Delgado, R; Roa-Sanchez, P; Speckter, H; Perez-Then, E; Rivera-Mejia, D; Foerster, B; Stoeter, P. Involvement of globus pallidus and midbrain nuclei in pantothenate kinase-associated neurodegeneration: measurement of T2 and T2* time. ClinNeuroradiol 2013;23:11-15
- Roa P, Bido P, Foerster B, Speckter H, Gonzalez CF, Oviedo J, Stoeter P: Evaluation of the "Tiger’s Eye" by Quantitative Susceptibility Imaging. ACR J Radiol Med Imaging 2017;2:7-11
- Doi H, Koyano S, Miyatake S, Matsumoto N, Kameda T, Tomita A, Miyaji Y, Suzuki Y, Sawaishi Y, Kuroiwa Y. Siblings with the adult-onset slowly progressive type of pantothenate kinase-associated neurodegeneration and a novel mutation, Ile346Ser, in PANK2: clinical features and (99m)Tc-ECD brain perfusion SPECT findings. J Neurol Sci. 2010; 290(1-2):172-6. doi: 10.1016/j.jns.2009.11.008.
- Melzer TR, Watts R, MacAskill MR, Pearson JF, Rüeger S, Pitcher TL, Livingston L, Graham C, Keenan R, Shankaranarayanan A, Alsop DC, Dalrymple-Alford JC, Anderson TJ.Arterial spin labelling reveals an abnormal cerebral perfusion pattern in Parkinson's disease. Brain. 2011; 134(Pt 3):845-855. doi: 10.1093/ brain/awq377.
- Teune LK, Renken RJ, de Jong BM, Willemsen AT, van Osch MJ, Roerdink JB, Dierckx RA, LeendersKL.Parkinson's disease-related perfusion and glucose metabolic brain patterns identified with PCASL-MRI and FDG-PET imaging. NeuroimageClin. 2014 3; 5:240-244. doi: 10.101 6/j.nicl.2014.06.007.
- Ze Wang, Geoffrey Aguirre, HengyiRao, JiongJiong Wang, Anna R. Childress, John A. Detre, Empirical ASL data analysis using an ASL data processing toolbox: ASLtbx, Magnetic Resonance Imaging, 2008, 26(2):261-269.
- Buxton RB, Frank LR, Wong EC, SiewertB, Warach S, Edelman RR. A general kinetic model for quantitative perfusion imaging with arterial spin labeling. MagnReson Med 1998; 40:383–396
- Hetzer S, Birr P, Fehlner A, Hirsch S, Dittmann F, Barnhill E, Braun J, Sack I. Perfusion alters stiffness of deep gray matter. JCereb Blood Flow Metab. 2018; 38(1):116-125.doi: 10.1177 /0271678X17691530.
- Hallervorden, J; Spatz H. Eigenartige Erkrankung im extrapyramidalen System mit besonderer Beteiligung des Globus pallidus und der Substantia nigra. Z Gesamte Neurol Psychiatr. 1922;79:254-302
- Gregory A, Hayflick SJ. Neurodegeneration with brain iron accumulation. Folia Neuropathol 2005;43:286-296
- Gupta R, Kumar A, Sharma MC, Sarkar C, Goyal V, Bihari M. Autopsy always teach and tell: neurodegeneration with brain iron accumulation: a case report. Indian J PatholMicrobiol 2007:50:792-794.
- Vilchez-Abreu C, Roa-Sanchez P, Fermin-Delgado R, Speckter H, Perez-Then E, Oviedo J, Stoeter P: El signo del "Ojo del Tigre" en resonancia magnética: cambios relacionados con la edad. Anal RadiolMexico 2013;3:189-196
- Detre JA, Alsop DC. Perfusion magnetic resonance imaging with continuous arterial spin labeling: methods and clinical applications in the central nervous system. Eur J Radiol. 1999; 30(2):115-24.
- Alsop DC, Detre JA, Golay X, Günther M, Hendrikse J, Hernandez-Garcia L, Lu H, MacIntosh BJ, Parkes LM, Smits M, van Osch MJ, Wang DJ, Wong EC, Zaharchuk G. Recommended implementation of arterial spin-labeled perfusion MRI for clinical applications: A consensus of the ISMRM perfusion study group and the European consortium for ASL in dementia. MagnReson Med. 2015; 73(1):102-16. doi: 10.1002/mrm.25197.
- Madai VI, Martin SZ, von Samson-Himmelstjerna FC, Herzig CX, Mutke MA, Wood CN, Thamm T, Zweynert S, Bauer M, Hetzer S, Günther M, Sobesky J. Correction for Susceptibility Distortions Increases the Performance of Arterial Spin Labeling in Patients with Cerebrovascular Disease. J Neuroimaging. 2016 Jul; 26(4):436- 44. doi: 10.1111/jon.12331. Epub 2016 Jan 27.