


|
|
DOI Prefix 10.20431 |
Information
Journal Policies
Evaluation of the "Tiger's Eye" by Quantitative Susceptibility Imaging
Pedro Roa1,Pamela Bido2,Bernd Foerster3,Herwin Speckter4,Cesar F.Gonzalez5,Jairo Oviedo6,Peter Stoeter7
2.Department of Radiology, CEDIMAT, Plaza de la Salud, Santo Domingo, Dominican Republic
Copyright : © 2017 . This is an open access article distributed under the Creative Commons Attribution License, which permits unrestricted use, distribution, and reproduction in any medium, provided the original work is properly cited.
Background: Pantothenate Kinase-Associated Neurodegeneration (PKAN) is characterized by accumulation of extracellular iron in Globus pallidus, which reduces signal in T2 weighted images and thus constitutes part of the so-called “Eye-of-the-Tiger” sign. This pilot study investigated if a new Magnetic Resonance Imaging technique, Quantitative Susceptibility Mapping (QSM), could be conducted with good results in this group of dystonic patients, who suffer from uncontrolled movements, and how results would compare to other quantitative methods.
Material and Methods: 6 patients with genetically confirmed PKAN and 11 control subjects of a similar age were included. Imaging was conducted on a 3T scanner and consisted out of measurement of T2- and T2* time and QSM with calculation of parameter maps. Individual Regions of Interest from both Globi pallidi and putamina were evaluated and compared to clinical data.
Results: All three parameters differed significantly between patients and controls in case of Globus pallidus (p< 0.01 to p< 0.001), but not in putamen. Correlation to clinical data however was limited.
Conclusion: As demonstrated by this pilot study, QSM is feasible in MRI of PKAN patients with good results, even in advanced stages of the disease. The lack of a close correlation between clinical symptoms and QSM results might be due to the small number of participants, but as well to a general lack of correlation between iron accumulation in the Globus pallidus and disease progression.
Posttraumatic pseudoaneurysm, superior cerebellar artery, subtentorial hemorrhage,Radiology and Medical Imaging
1. Background
The “Eye-of-the-Tiger-sign“ is a diagnostic hallmark in Pantothenate Kinase-Associated Neurodegeneration (PKAN), an autosomal recessive metabolic disease, which affects the Globus pallidus and is clinically characterized by progressive dystonia. In T2 weighted Magnetic Resonance Imaging (MRI), this sign consists out of a bright spot in the anterior part of the Globus pallidus and a hypointense area surrounding it. According to findings in very young patients [1], the hyperintensity is thought to represent the initial lesion, whereas the surrounding dark area is secondary and caused by the accumulation of extravascular iron [2-4].
In spite of some preclinical trials to replace the lacking metabolic product [5,6] up to now, there is no established causal therapy.
Due to its oxidative properties, free iron itself can induce tissue damage and thus may contribute to the progression of the disease [7]. Therefore some effort has been taken to reduce the iron concentration in the Globus pallidus. A multi-center trial with deferiprone as iron chelator is now underway and first reports could indeed demonstrate a reduction of the hypointense areas in the Globus pallidus [8-10].
Until now, T2 and T2* time measurements have been used as surrogate markers for tissue iron content in these trials. Both parameters however, depend on progression of myelination with age, and reduction of water content in myelin might influence results especially during infancy and adolescence [11,12]. Recently, Quantitative Susceptibiliy Mapping (QSM), which -apart from flow- mainly depends on (in-) homogeneities of the local magnetic fields [13,14] has been used to determine iron concentrations in the brain [15-17].
Although this technique is highly susceptible to movement artifacts, we conducted a pilot study in 6 known PKAN patients to demonstrate feasibility of QSM in dystonic patients suspected to belong to the group of Neurodegeneration with Brain Iron Accumulation (NBIA) and compared results to Mapping of T2 and T2* time.
2. Materials And Methods
The study had been approved by the CEDIMAT Ethics Committee, and informed consent had been received from all participants.
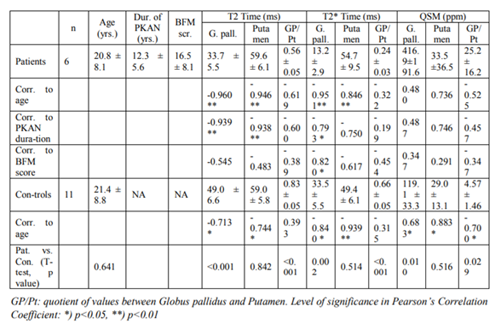
Included were 6 patients (table 1) with genetically confirmed [18] PKAN disease of an age range from 7 to 30 years (mean: 20.8 years), 1 female and 5 male, and an age-matched control group of 11 healthy volunteers (mean age 21.4 years, 4 female and 7 male). Patients had been suffering from PKAN from 6 to 19 years (mean: 12.5 years) and their score on the Burke-Fahn-Marsden (BFM) Scale was between 14 and 26 points (mean: 20.5 points).
A 3 Tesla scanner was used (Philips Achieva release 2.6).
Apart from routine T2-weighted and MPRAGE imaging, we applied the following sequences to examine signal changes possibly induced by iron accumulation in the basal ganglia:
T2 Time: 3D Gradient and Spin Echo Sequence (GRASE), 5 coronal slices of 3mm centered to the basal ganglia. TR 1000 ms, TE 6.7 ms, flip angle 90°. 32 echoes with 6.7 ms spacing. Pixel size 0.5 x 0.5mm. T2 time maps were calculated by scanner-provided software using a non-linear fit and an algorithm based on maximum-likelihood estimation software [19].
T2* Time: 3D FFE sequence, 10 transversal slices of 4 mm thickness through the basal ganglia. TR 329 ms, TE 2.1 ms, flip angle 12°. 10 echoes with 3.2 ms spacing. Pixel size 1.3 x 1.3 mm. T2* maps were calculated with in-house software developed in Python (www.python.org). Data were fitted to a mono-exponential decay model using the Levenberg-Marquardt algorithm from the Scipy scientific libraries (www.scipy.org).
QSM: T1 weighted 3D FFE sequence, 50 transversal slices of 1.3 mm thickness centered to the basal ganglia. TR 50 ms, TE 4.6 ms, flip angle 12°. 10 echoes with 4.6 ms spacing. Pixel size 1.3x1.3 mm. For calculation of QSM maps, we used the MEDI (Morphology-Enabled DipoleInversion) toolbox (http://weill.cornell.edu/mri/QSM/MEDI_toolbox) running on MATLAB.
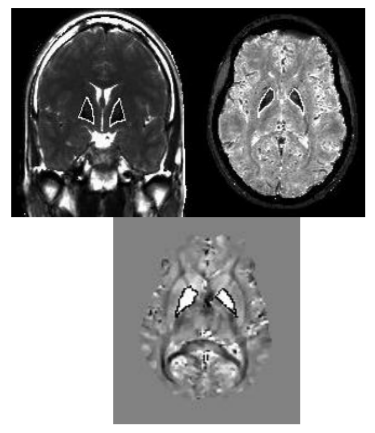
Further postprocessing was done on the MRIcro platform (www.cabi.gatech./mricro) by extracting T2- and T2*times and QSM values from Regions of Interest (ROIs) of both Globi pallidi and putamina drawn individually on the corresponding maps (Figure. 1). Data were correlated (Pearson’s test) to patients’ age, duration of disease and BFM scale scoring and compared to control group by 2-tailed t test. Level of significance was set to 95%.
3. Results
In Globus pallidus, T2 time (33.7 vs. 49.9 ms), T2*time (13.2 vs. 33.5 ms) and QSM values (416.9 vs. 119.1 ppm) differed significantly between patients and controls (p< 0.01 to p< 0.001), whereas those of the putamina did not (table 1).
In patients, T2- and T2* time, but not QSM values, showed a highly significant correlation to age (p< 0.001). T2 time of both Globus pallidus and putamen correlated highly significant to duration of disease (p< 0.001) as did T2* time of Globus pallidus, but with lower significance (p< 0.05). Correlation to BFM score was only seen in T2* time of Globus pallidus.
In control individuals, T2 time, T2* time and QSM values of Globus pallidus and of putamen, correlated significantly to age (p < 0.05 to p< 0.001).
4. Discussion
This is the first report on QSM measurements in PKAN patients where results were compared to more conventional techniques of mapping of the iron content of the basal ganglia such as T2- and T2* time measurements. QSM uses phase information which is the most sensitive method to detect even slight changes in local magnetic field. On top of this high sensitivity, QSM adds an analysis based on magnetic dipole modeling that permits to reproducibly measure the effect in a quantitative manner. QSM is less sensitive to myelination than T2 and/or T2* measurements and may eliminate potential confounding effects of those techniques [20].
All patients tolerated the procedure well, and there were no undue movement artifacts to impede image postprocessing. Thus, QSM is feasible with good results in dystonic patients in spite of their tendency to uncontrolled movements. As expected, patients showed significantly higher QSM values in Globus pallidus as compared to controls. This change of susceptibility has already been demonstrated in the context of Susceptibility-Weighted Imaging (SWI) [21] and has been quantified by T2- and T2* time measurements [22-24]).
QSM values of patients did not show any significant correlation to age and not to disease parameters as duration of symptoms or BFM score. This finding was unexpected, but might be explained by the small number of patients. In the putamina, correlations to age and as well to duration of disease were just below the level of significance. The latter (correlation to disease duration) may be seen more as an effect of aging than of progression of disease, because in our controls, QSM values from the putamina, but not from Globus pallidus, showed a similar high correlation to age, and this has been reported before in two QSM studies [25,26].
The finding of a rather limited correlation between susceptibility-induced signal changes in Globus pallidus and clinical data in PKAN is not new [21] and has been attributed to the hypothesis, that iron accumulation is a secondary effect with limited contribution to progression of the disease itself [27]. This view is supported by the results of the therapy with deferiprone as iron-chelating agent, which –as mentioned before- was able to increase T2* time in Globus pallidus, but without much clinical improvement of the dystonia [8,10]. Final results of the TIRCON study dealing with this therapy have to be awaited (tircon.eu/nbia-clinical-network).
Without doubt, a limitation of this study is the small number of cases, which does not allow to determine, which technique, T2- or T2* time or QSM, shows closer correlation to clinical progression of PKAN, or if there is no correlation at all. Taking into consideration that PKAN with a prevalence of about 1 : 1,000,000 is listed among the orphan diseases, larger studies might be difficult to conduct in a single center.
5. Conclusion
As demonstrated by this pilot study, QSM is feasible in MRI of PKAN patients with good results, even in advanced stages of the disease. The lack of a close correlation between clinical symptoms and QSM results might be due to technical limitations and the small number of participants, but as well to a general lack of correlation between iron accumulation in the Globus pallidus and disease progression. To decide which MRI technique is suited best to monitor not just “improvement” of images, but symptom-related effects of iron reduction therapies, a larger study including follow-ups has to be conducted.
References
- Rossi D, De Grandis E, Barzaghi C, Mascaretti M, Garavaglia G, Yanotto E, Morana G, and Biancheri R. Early-onset neurodegeneration with brain iron accumulation due to PANK2 mutation. Brain Dev 2012;34:536-538
- Gregory A, Hayflick SJ. Neurodegeneration with brain iron accumulation. Folia Neuropathol 2005;43:286-296
- Hayflick SJ, Hartman M, Coryell J, Gischier J, Rowley H. Brain MRI in neurodegeneration with brain iron accumulation with and without PANK2 mutations. AJNR Am J Neuroradiol 2006;27:1230-1233
- Gupta R, Kumar A, Sharma MC, Sarkar C, Goyal V, Bihari M. Autopsy always teach and tell: neurodegeneration with brain iron accumulation: a case report. Indian J Pathol Microbiol 2007; 50:792-794.
- Christou YP, Tanteles GA, Kkolou E, Ormiston A, Konstantopoulos K, Beconi M, Marshall RD, Plotkin H, Kleopa KA. Open-Label Fosmetpantotenate, a Phosphopantothenate Replacement Therapy in a Single Patient with Atypical PKAN. Case Rep Neurol Med. 2017; 2017: 3247034. doi: 10.1155/2017/32403 4.
- Roa P, Stoeter P, Perez-Then E, Santana M, Marshall RD. A Potential Phosphopantothenate Replacement Therapy in 2 Patients With Pantothenate Kinase-Associated Neuro degeneration. Int J Rare Dis Orphan Drugs 2017;2:1006-1012
- Schneider SA, Bhatia KP. Excess iron harms the brain: the syndromes of neurodegeneration with brain iron accumulation (NBIA). J Neural Transm (Vienna). 2013;120:695-703
- Zorzi G, Zibordi F, Chiapparini L, Bertini E, Russo L, Piga A, Longo F, Garavaglia B, Aquino D, Savoiardo M, Solari A, Nardocci N. Iron-related MRI images in patients with pantothenate kinase-associated neuro degeneration (PKAN) treated with deferiprone: results of a phase II pilot trial. MovDisord. 2011; 26: 1756-1759.
- Pratini NR, Sweeters N, Vichinsky E, Neufeld JA. Treatment of classic pantothenate kinase-associated neurodegeneration with deferiprone and intrathecal baclofen. Am J Phys Med Rehabil. 2013;92:728-33
- Cossu G, Abbruzzese G, Matta G, Murgia D, Melis M, Ricchi V, Galanello R, Barella S, Origa R, Balocco M, Pelosin E, Marchese R, Ruffinengo U, Forni GL. Efficacy and safety of deferiprone for the treatment of pantothenate kinase-associated neurodegeneration (PKAN) and neurodegeneration with brain iron accumulation (NBIA): results from a four years follow-up. Parkinsonism RelatDisord. 2014; 20:651-654.
- Hwang D, Kim DH, Du YP. In vivo multi-slice mapping of myelin water content using T2* decay. Neuroimage 2010; 52:198-204.
- Leon-Wyss J, Foerster B, Rosario C, Toribio J, Speckter H, Oviedo J, Stoeter P. Influence of oxygen saturation and age on relaxation time of grey and white matter and diffusion tensor imaging parameters in children with cardiac malformations. J Pediatr Neuroradiol 2016;5: 248-252
- Haacke EM, Mittal S, Wu Z, Neelavalli J, Cheng YC. Susceptibility-weighted imaging: technical aspects and clinical applications, part 1. AJNR Am J Neuroradiol. 2009; 30:19-30.
- Mittal S, Wu Z, Neelavalli J, Haacke EM. Susceptibility-weighted imaging: technical aspects and clinical applications, part 2. AJNR Am J Neuroradiol. 2009;30:232-252
- Reichenbach JR, Schweser F, Serres B, Deistung A. Quantitative Susceptibility Mapping: Concepts and Applications. ClinNeuroradiol. 2015; 25 Suppl2:225-230.
- Liu C, Li W, Tong KA, Yeom KW, Kuzminski S. Susceptibility-weighted imaging and quantitative susceptibility mapping in the brain. J MagnReson Imaging. 2015;42:23-41
- Soman S, Bregni JA, Bilgic B, Nemec U, Fan A, Liu Z, Barry RL, Du J, Main K, Yesavage J, Adamson MM, Moseley M, Wang Y. Susceptibility-Based Neuroimaging: Standard Methods, Clinical Applications, and Future Directions. CurrRadiol Rep. 2017 Mar; 5(3). pii: 11. doi: 10.1007/s40134-017-0204-1
- Schiessl-Weyer J, Siegl C, Roa P, Laccone F, Tichy A, De Almeida Ribeiro E, Prohaska R, Stoeter P, Salzer U. Acanthocytosis and the c.680 A>G mutation in the PANK2 gene: a study enrolling a cohort of PKAN patients from the Dominican Republic. PloS One. 2015; 10(4):e0125861.
- Sénégas J, Bos C, Dahnke H. Determining precision of relaxation time measurements: application to T2 mapping. 16th Annual Meeting of ISMRM, Toronto, 2008. Proceedings p 1421.
- Wang Y, Liu T. Quantitative susceptibility mapping (QSM): Decoding MRI data for a tissue magnetic biomarker. MagnReson Med. 2015;73:82-101
- Vilchez-Abreu C, Roa-Sanchez P, Fermin-Delgado R, Speckter H, Perez-Then E, Oviedo J, Stoeter P. El signo del “Ojo del Tigre” en resonancia magnética: cambios relacionados con la edad. Anal Radiol Mexico 2013;3:189-196
- Hájek M, Adamovicová M, Herynek V, Skoch A, Jírů F, Krepelová A, Dezortová M. MR relaxometry and 1H MR spectroscopy for the determination of iron and metabolite concentrations in PKAN patients. Eur Radiol. 2005;15:1060-1068.
- Szumowski J, Bas E, Gaarder K, Schwarz E, Erdogmus D, Hayflick S. Measurement of brain iron distribution in Hallervorden-Spatz syndrome. J Magn Reson Imaging 2010;31:482-489.
- Fermin-Delgado R, Roa-Sanchez P, Speckter H, Perez-Then E, Rivera-Mejia D, Foerster B, Stoeter P. Involvement of Globus Pallidus and Midbrain Nuclei in Pantothenate Kinase-Associated Neurodegeneration : Measurement of T2 and T2* Time. Clin Neuroradiol. 2013;23:11-15.
- Bilgic B, Pfefferbaum A, Rohlfing T, Sullivan EV, Adalsteinsson E. MRI estimates of brain iron concentration in normal aging using quantitative susceptibility mapping. Neuroimage. 2012; 59:2625-2635.
- Betts MJ, Acosta-Cabronero J, Cardenas- Blanco A, Nestor PJ, Düzel E. High-resolution characterisation of the aging brain using simultaneous quantitative susceptibility mapping (QSM) and R2* measurements at 7T. Neuroimage. 2016;138:43-63
- Meyer E, Kurian MA, Hayflick SJ. Neurodegeneration with Brain Iron Accumulation: Genetic Diversity and Pathophysiological Mechanisms. Annu Rev Genomics Hum Genet 2015; 16:257-279.