


|
|
DOI Prefix 10.20431 |
Information
Journal Policies
Tissue Iron Distribution and Quantification in Children with Rare Congenital Anemias by Means of R2-MR Imaging
Olympia Papakonstantinou1*,Konstantina Foufa1,Vasiliki Bizimi1,Efie Rigatou2,Sophia Delicou3,StavroulaKostaridou1,Efthymia Alexopoulou1,Nikolaos L.Kelekis1,Sophia Polychronopoulou2
2.Department of Pediatric Hematology/Oncology, ʺAghia Sophia” Children's Hospital, Athens, Greece.
3.PediatricDepartment Children’s General Hospital of Penteli, Athens, Greece.
Copyright : © 2018 Authors. This is an open-access article distributed under the terms of the Creative Commons Attribution License, which permits unrestricted use, distribution, and reproduction in any medium, provided the original author and source are credited.
Purpose: To describe patterns of iron distribution among liver, spleen, pancreas, bone marrow (BM) and myocardium with Quantitative MR- R2 relaxometry, in seven patients with rare congenital anemias other than hemoglinopathies.
Methods: We retrieved the Quantitative MR imaging studies of seven patients with rare congenital anemias, including Diamond Blackfan anemia (n=2), Fanconianemia (n=3), aplastic anemia (n=1), congenital dyserythropoietic anemia (n=1) and six healthy controls. Patients’ serum ferritin levels closest to MR examination were also recorded.
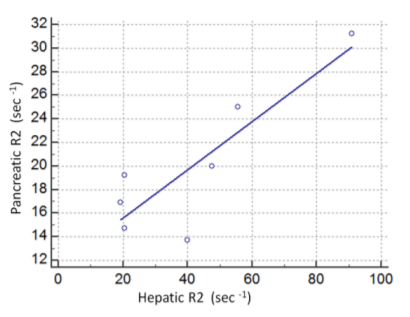
Results: Liver R2 values were increased in all patients, splenic R2 in six and pancreatic and VBM R2 in five patients, respectively (> mean +2SD of R2s of controls). No decrease of myocardial R2 values was revealed. Pancreatic R2 values correlated with hepatic and VBM R2 (r=0.775, p< 0.05 and r=0.82, p< 0.05) whereas serum ferritin correlated only with hepatic and pancreatic R2 (r=0.75, p< 0.05 and r=0.88, p< 0.008).
Conclusions: Iron overload, as expressed by R2 relaxation time values, was found to present non uniform patterns of iron distribution between liver, spleen, pancreas and VBM in patients with rare congenital anemias other than hemoglinopathies. hepatic and pancreaticsiderosis were found to correlate with total iron stores in contrast to findings with larger series of patients with hemoglinopathies.
Fanconi, Diamond Blackfan, Dyserythropoieticanemia, type II (CDA, II), R2 relaxometry, iron overload,Hematology
1. Introduction
Rare congenital anemias other than hemoglinopathies, including FanconAnemia (FA), plasticAnemia (AA), DiamondBlackfanAnemia (DBA) and CongenitalDyserythropoieticAnemia (CDA), comprise an heterogenous group of hereditary anemias characterized by red cell or multiple age hypoplasia with or without morphologic abnormalities of erythroblasts and often associate with developmental abnormalities [1-5]. They require regular red blood cell transfusions to prolong survival, which, in turn leads to significant iron overload in vital organs such as liver, heart, pancreas and endocrine glands [5-8].The toxic effects of iron can be compromised with administration of chelation therapy but side effects are not uncommon [9-10]. Therefore, regular and accurate monitoring of iron status is imperative for patient management [6-8].
Quantitative MR imaging has emerged as a non invasive means for quantification of tissue iron overload and has largely substituted liver biopsy [11]. However, despite numerous reports in thalassemia, sickle cell disease, hematologic malignancies or hereditary hemochromatosis [12-23], there have been limited data on MR quantification and distribution of iron in multiple transfused patients with rare congenital anemias other than hemoglobinopathies [6-8,19,23].
In this study, we applied R2 relaxometry to assess tissue iron in young patients with rare congenital anemias, including FA, AA, DBA and CDA. Our objectives are: (a) to investigate the degree of iron overload in liver, spleen, pancreas, bone marrow and myocardium, as expressed by R2 relaxation values and assess patterns of iron distribution in regard to underlying anemia (b) correlate relaxation rates (R2) of each individual tissue with total iron stores.
2. Materials And Methods
We retrospectively reviewed from the electronic archives of our department, the Quantitative MR imaging studies of seven patients with rare congenitalanemias, other than hemoglinopathies (3males, 4 females, mean age: 9, 8+5 ,7 yrs, range: 4-21 yrs) including Fanconi anemia (n=3), a plastic anemia (n=1), DBA (n=2) and CDA (n=1). The study protocol was approved by the ethics committee for retrospective studies of our institution. All MR imaging studies were performed for quantification of iron overload in liver and myocardium, over a nine-year period. The control group consisted of six healthy volunteers (two males and three females, mean age 29, 5± 3yrs) with no history of liver disease or blood transfusions; measurements from these volunteers had been employed in previous studies of our group.
We retrieved clinical information and serum ferritin values from the data base system attached to the MR studies. Recorded serum ferritin levels had been obtained 1-5 weeks before the MR examination, determined with the enzyme-linked immunosorbent assay (ELISA) technique and expressed in ng/ml (normal values: 20–200 ng/ml). All patients had received red blood cells transfusions at 2-4 week intervals and subcutaneous chelation with desferriox amine or defer asiroxperos or combined treatment. Compliance with chelation therapy varied among patients so a wide range of iron overload was expected.
All MR studies were performed on a 1.5 T MR imaging system (Philips NT Intera; Philips Medical Systems, Best, The Netherlands). A quadrature radiofrequency (RF) body coil was used for both signal excitation and reception to ensure the highest uniformity in the signal-to-noise ratio throughout the scanned volume. For calculation of R2 values we employed a single-slice Carr-Purcell-Meiboom-Gill (CPMG) spin-echo sequence with 16 equidistant echoes and a short echo spacing of 5 msec(TR=2000 msec, TE1, TE2,…, TE16 = 5, 10,.., 80 msec, flip angle=90°, acquisition matrix 192x256, slice thickness = 10 mm), in the axial plane, with end-expiration triggering, according to previously published methodology (17). The imaging plane included the right liver lobe, part of the pancreas, the spleen and the vertebral body or arch of the first or second lumbar vertebra. Subsequently, imaging of the heart was performed in all patients. A double oblique imaging plane was used to obtain a pseudo-four-chamber view of the heart, whereas both respiratory and cardiac triggering were applied in diastole. Additionally, we obtained T1-weighted in and out-of-phase spoiled- GRE axial images (TR/TE/flip angle: 120/4, 6/80 and 120/2.3/90 and a half-Fourier single shot TSE, HASTE (TR/TE: 854/80) in the coronal plane, as part of our regular upper abdominal MRI protocol for inspection of the upper abdomen.
T2 values were calculated automatically on the scanner’s console and T2 map images were reconstructed for both cardiac and abdominal scans. The fitting procedure for T2 calculations was incorporated in Philips Intera MR system, and was based on a weighted Ratios Least Square (RLSQ) algorithm where all 16 image-echoes were fitted in order to calculate T2 (22).
T2 values of the liver, spleen, pancreas and vertebral bone marrow (VBM) were obtained on the T2 maps. For liver, two ROIs (diameter 1-2 cm²) were selected in the right lobe away from vascular structures and breathing or pulsation artifacts. For spleen, two or three ROIs were applied in the periphery of the organ. For pancreas, one or two ROIs were placed within its parenchyma, away from its boundaries. For VBM, two ROIs were placed either at the anterior part of L1/L2 vertebral body or at their neural arch. For myocardium, ROIs were drawn on the myocardium of the left ventricle free wall, avoiding neighboring pericardial tissue, coronary vessels, and motion artifacts [22].All the above measurements with the standard deviations (SD) were recorded, and the average for each organ for R2 (R2=1/T2) was used for statistical analysis. Subsequently, in order to investigate for possible fatty infiltration of the liver and pancreas, ROIs were placed on the in and out-of- phase GRE images at exactly the same locations as we did for T2 map images using the same coordinates. Signal intensity changes of the liver and pancreas between in-phase and opposed- phased images were assessed by visual inspection and by means of a signal index calculated as: [(signal intensity on in-phase images-signal intensity on opposed-phase images)/signal intensity on in-phase images] ×100. Fatty change of the pancreas or the liver was considered if the index was positive [24].
All analyses were performed using statistical software (Medcalc Software, Vs 7.3, Belgium and Table Curve 2D, Systat Software Inc., Chicago IL). Linear regression analysis (Pearson’s correlation coefficient) was employed for correlation between R2 values of liver, spleen, bone marrow, bone marrow, and ferritin values and paired t-test to compare R2 relaxation rate values between patients and controls. A p value < 0.05 was considered significant in all tests.
3. Results
Patients’ demographics, serum ferritin levels and R2 values of the liver, spleen, pancreas, vertebral bone marrow and myocardium, for each individual patient, are presented in Table 1
Patients presented with statistically significant increased R2 values of the abdominal solid organs and vertebral bone marrow compared with healthy controls, as shown in Table 2.
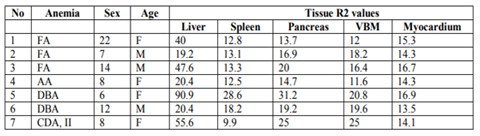
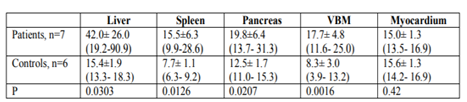
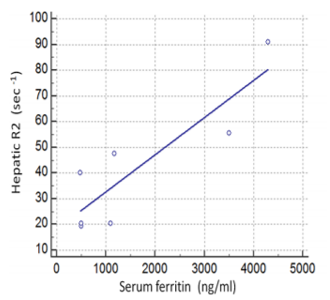
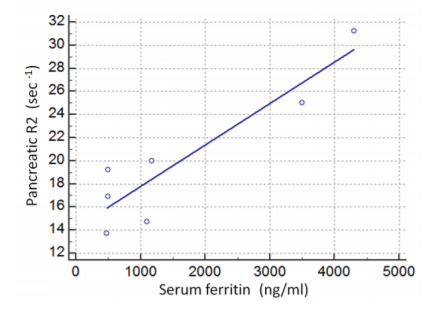
In particular, all seven patients presented with increased hepatic R2 values (less than mean R2 +2SD of normal controls), six with increased splenic and five with increased VBM and pancreatic R2 values. Myocardial R2 values were not statistically increased in any patient. Despite the small number of patients, serum ferritin correlated both with hepatic R2 (r=0.75, p< 0.05, Figure 1) and pancreatic R2 values(r=0.88, p< 0.008, Figure 2), whereas no statistically significant correlations were found between serum ferritin and splenic, VBM and myocardial R2 values. Significant correlations were revealed between hepatic R2 and pancreatic R2(r=0.775, p< 0.05, Figure 3) and between pancreatic and VBM R2 values (r=0.82,p< 0.05). Myocardial and splenic R2 values did not correlate with R2 values of any other tissue.
We considered the patterns of iron distribution in regard to the type of the underlying anaemia: both patients with DBA presented with severe iron deposition (significantly increased R2 values) in liver, spleen, pancreas and in a lesser extent, VBM (Fig 4a). of the patients with Fanconianemia, two had significant hepatic siderosis with mild or no siderosis of the pancreas, spleen and VBM (Fig 4b), whereas the patient with CDA II exhibited an un expected pattern with sparing of the spleen despite significant siderosis of the liver, spleen, VBM and pancreas (Fig 4c). We also reviewed the T1-GRE opposed phase images; on visual inspection, there was no signal decrease on out-of-phase images in the liver and pancreas whereas the signal index was negative in all patients, on initial or on repeat examinations, signifying absence of fatty change. Follow-up studies were available in three patients; one patient with CDA and two patients with DBA; the first patient presented with no significant alteration of hepatic R2 in a 5-yr-period despite decreased serum ferritin levels, whereas both patients with DBA showed improvement of R2 values of all tissues along with decreased serum ferritin.
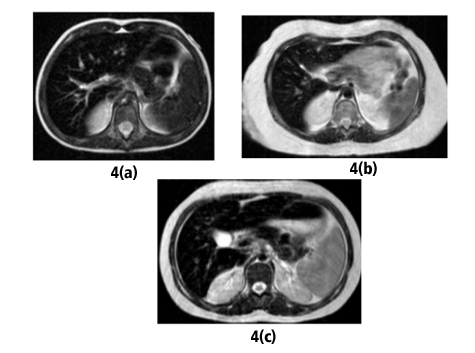
4(a) (Patient no5) Marked Hypointensity of the Liver, Spleen and PancreasiIs Shown in a Six-YearOld Girl with DBA.
4(b) (Patient No1) There Is Hypointensity of the Liver with Sparing of the Pancreas and VBM in a 22-Year Old Female Patient with Fanconi Anemia.
4(c) (Patient No7) Significant Hypointensity of the Liver, Pancreas and VBM with Sparing of the Spleen are Seen in an Eight-Year-Old Girl with CDA, II.
VBM: Vertebral Bone Marrow, DBA: DiamondBlackfanAnemia,FA: Fanconi Anemia, CDA, II:Congenital Dyserythropoietic Anemia, Type II.
4. Discussion
In this study we assessed tissue iron overload with R2 relaxometry, in young patients with rare congenital anemias other than hemoglobinopathies. AplasticAnemia (AA) is a pancytopenia with severe marrow hypoplasia of all three lines; red cells, white cells and platelets. Recognized etiologies include occupational exposure to toxics or radiation, drugs, and viral infections although in most patients no cause is identified, as in our patient. Many patients will ultimately develop a clonal marrow disorder, such as myelodysplastic syndrome or paroxysmal nocturnal hemoglobinuria [1]. FanconiAnemia (FA) is a subtype of aplastic anemia, accounting for approximately 25% of the cases of aplastic anemias. It is often associated with growth retardation, abnormalities of the renal tract and endocrine glands and congenital defects of the skeleton, such as microcephaly and absent radii or thumbs. Not infrequently patients develop acute myeloid leukemia and less commonly, myelodysplastic syndrome and liver tumors. Treatment includes androgens with or without stem cell transplantation along with blood transfusions [2]. Diamond Blackfan Anemia (DBA) is a rare congenital bone marrow failure syndrome, characterized by early onset macrocytic anemia, reticulopenia and paucity of erythroid precursors. Growth retardation and various congenital abnormalities may coexist including craniofacial dysmorphism, upper limb anomalies, urogenital malformations and congenital heart defects whereas predisposition to hematologic malignancies and solid tumors exists [4,5]. Oral steroids are the first line treatment but patients who are steroid resistant require a regular transfusion program. Congenital DyserythropoieticAnemia, typeII (CDAII) is the most common form of congenital dyserythropoietic anemia other than hemoglinopathies, also known as EMPHAS (hereditary erythroblast multinuclearity with a positive acidified serum lysis test) which manifestates with anemia of variable severity, jaundice and splenomegaly [3].
Most patients with either of the above rare anemias require regular blood transfusions since infancy with subsequent iron overload. Chelation therapy has dramatically improved life expectancy of transfusion dependent patients, but nephrotoxicity, hepatotoxicity and gastrointestinal disturbances are not uncommon complications particularly in patients with FA [10]. The cornerstone for prevention the sequelae of iron overload and, on the other hand, avoid the complications of overchelation [7-9] is the regular and accurate monitoring of iron overload. Serum ferritinstill remains the screening method of choice for increased total iron burden but is not representative of iron deposition in extra hepatic tissues [25,26] and occasionally, even in liver, whereas its value as an iron overload marker has not been fully explored in rare congenital anemias. One of our patients with CDA, II showed decreased ferritin levels during follow up but hepatic R2 remained high. Liver iron concentration on liver biopsy specimens has been considered the gold standard for decades, but it is an invasive procedure [9,25]. Nowadays MR imaging is been employed in many institutions as a non invasive alternative to liver biopsy [11-25,29] with the additional benefit of imaging tissues other than the liver in the same study.
To the best of our knowledge, MR estimation of tissue iron in patients with FA, or AA has not been addressed whereas there are sporadic descriptions in patients with CDA [7] and few recent studies on MR assessment of hepatic, pancreatic and cardiac iron overload in patients with DBA [6-8,19,23].All patients of our study had been studied with R2-relaxometry by means of a multiecho- single slice sequence based on previously published data(17).Four of the patients, two with DBA, one with CDA and one with FA presented with severe hepatic and pancreatic siderosis despite their young age and early onset of chelation whereas the remaing three patients exhibited milder tissue siderosis. To our experience, we have scarcely encountered very young (less than 10 yrs old) patients with thalassemia or sickle-cell disease with similar levels of hepatic and extra hepatic iron deposition, as expressed by R2 values, among more than 300 thalassemics examined in our institution over the last fifteen years. Our data agree with Roggero et al who found that DBA patients displayed significantly higher LIC, as estimated with magnetic susceptometry (SQUID), compared with a matched group of patients with beta thalassemia major [6]. Berdoukas et al also reported early onset of hepatic and extrahepatic iron overload in patients with DBA and CDA, shown on MR imaging[7]. Lack of utilization of transferin iron has been reported in patients with DBA and may account for severe total iron burden even at an early age [28]. We observed variability both in severity and distribution of iron among the three patients with Fanconi’s anemia. Such diversity in tissue iron deposition has also been observed in larger series of patients with thalassemia [27].It has been postulated that patient specific bioavailability of chelators may account for variability of iron distribution, regardless the underlying type of anemia [9]. We did not document iron deposition in myocardium in any of our patients. Previous studies using R2* relaxometry [29] revealed myocardial iron in DBA patients. We had employed R2 instead R2* for the assessment of siderosis because most referred patients in our institution suffered from severe iron overload and R2 preferable to R2* to discriminate differences in high iron concentrations that is most meaningful for patients’ follow-up . Despite the limited number of our patients, pancreatic R2 values correlated with hepatic and VBM values, in contrast to larger series with thalassemic patients which did not document significant correlations between pancreatic and hepatic or VBM R2 or R2*values .It is probable that pancreatic R2 values correlated with serum ferritin because of the younger age of our patients and the lack of fatty change of the pancreas – as documented on opposed-phase images. In contradistinction, in older patients, the frequently concomitant fat interferes with iron in R2 estimations . During the recent years, attention has been drawn to pancreatic siderosis, since iron accumulation in pancreas incites oxidative stress and gradual fatty replacement that associate with disturbances of glucose metabolism . Moreover, pancreatic siderosis has been considered a precursor of cardiac siderosis in patients with thalassemia major [27]. It was noteworthy that spleen was spared in one patient with CDA and severe iron deposition in liver, VBM and pancreas; unpredictable patterns of iron deposition in spleen have also been observed in thalassemic patients and the reason remains unclear [22].
Our study has limitations: most important, the study group is small and heterogeneous, due to the rarity of these anemias. There is paucity of systematic studies on the pathophysiology of iron in patients with these rare congenital anemias [28]; further studies with MR imaging and larger number of patients might help to elucidate iron kinetics in regard to underlying disease.
In conclusion, a variety of patterns of iron deposition may be seen in multiple transfused patients with rare congenital anemias, since an early age. MR imaging is a powerful tool for the monitoring of chelation therapy and the evaluation of target organs.
References
- Lambert JF, Beris P. Pathophysiology and differential diagnosis of anaemia. In:ESH, Handbook on disorders of iron metabolism (2009) Available from: http://www.esh.org/esh-handbook-on-disorders-of-ion-metabolism-2009
- Dufour C, Svahn J. Fanconianaemia: new strategies. Bone Marrow Transplant.2008; 41: S90-95.
- Kostaridou S, Polychronopoulou S, Premetis E, Papassotiriou, Stmoulakatou A, Haidas S. Ineffective erythropoiesis underlies the clinical heterogeneity of congenital dyserythropoietic anemia type II (CDA, II). PediatrInt 2004; 46: 274-279.
- Delaporta P, Sofocleous C, Stiakaki E et al. Clinical phenotype and genetic analysis of RPS19, RPL5 and RPL11 genes in greek patients with Diamond-Blackfan anemia. Pediatr Blood Cancer 2014; 61: 2249-2255.
- Vlachos A, Ball S, Dahl N. Diagnosing and treating Diamond Blackfan anemia: results of an international clinical consensus conference. Br J Hematol 2008; 142: 859-876.
- Roggero S, Quarello P, Vinciquerra T, Longo F, Piga A, Ramenghi U. Severe iron overload in Blackfan-Diamond anemia. A case-control study. Am J Hematol 2009; 84: 729- 732.
- Berdoukas V, Nord A, Carson S, et al. Tissue iron evaluation in chronically transfused children shows significant levels of iron loading at a very young age. Am J Hematol 2013; 88: E283-E285
- Garceau P, Nguyen ET, CarassoS et al. Quantification of iron deposition by two – dimensional speckle tracking in patients with β-thalassemia major and Blackfan-Diamond anaemia. Heart 2011; 97: 388-393.
- Wood J. Estimating tissue iron burden: Current status and future prospects. Br J Haematol 2015; 170: 14-28.
- Tunc B, Tavil B, Karakurt N, et al. Deferasirox therapy in children with Fanconi aplastic anemia. J PediatrHematolOncol2012; 34: 247-251.
- Wood JC, Zhang P, Reinhoff H, Abi-Saab W, Neufeld EJ. Liver MRI is more precise than liver biopsy for assessing total iron balance: a comparison of MRI relaxometry with simulated liver biopsy results. MagnReson Imaging 2015; 33: 761-767.
- St Pierre TG, Clark, PR., Chua-Anusorn W. Noninvasive measurement and imaging of liver iron concentrations using proton magnetic resonance. Blood 2005; 105: 855–861.
- Wood JC. Cardiac iron across different transfusion-dependent diseases. Blood Reviews 2008; 22:S14–S21.
- Wood JC, Zhang P, Rienhoff H, Abi-Saab W, Neufeld E. R2 and R2* are equally effective in evaluating chronic response to iron chelation. Am J Hematol 2014; 9: 505–508
- Badawy SM, Liem RI, Rigsby CK, Labotka RJ, DeFreitas RA, Thompson AA. Assessing cardiac and liver iron overload in chronically transfused patients with sickle cell disease. Br J Haematol 2016; Epubdoi: 10.1111/bjh.14277
- Idilman IS, Akata P, Ozmen MN, Karcaaltincaba M. Different forms of iron accumulation in the liver on MRI. DiagnIntervRadiol 2016; 22: 22-28.
- Alexopoulou E, Stripeli F, Baras P, et al. R2 relaxometry with MRI for the quantification of tissue iron overload in beta- thalassemic patients. J MagnReson Imaging 2006; 23:163-170.
- Virtanen JM, Remes KJ, Itälä-Remes MA, et al. The relationship between cardiac and liver iron evaluated by MR imaging in haematological malignancies and chronic liver disease. Blood Cancer J. 2012; Epubdoi: 10.1038/bcj.2011.48.
- Ferguson M, Otto RK, Bender MA, Kolokythas O, Friedman SD. Liver and heart MR relaxometry in iron loading: reproducibility of three methods. J MagnReson Imaging 2013; 38: 987-990.
- Argyropoulou MI, Kiortsis DN, Astrakas L, Metafratzi Z, Chalissos N, Efremidid SC. Liver, bone marrow, pancreas and pituitary gland iron overload in young and adult thalassemic patients: a T2 relaxometry study. EurRadiol 2007; 17: 3025-3030.
- Gandon Y, Olivie D, Guyader D, et al. Non-invasive assessment of hepatic iron stores with MRI. Lancet 2004; 363: 357-362.
- Papakonstantinou O, Alexopoulou E, Economopoulos N, et al. Assessment of iron distribution between bone marrow, liver, spleen, pancreas, and myocardium by means of R2 relaxometry by MRI in patients with beta-thalassemia major. J MagnResonImaging 2009; 29:853-9.
- Pfeifer C, Schoennagel BP, Grosser R et al. Pancreatic iron and fat assessment by MRI-R2* in patients with iron overload diseases.J MagnResonImaging 2015; 42: 196-203
- Papakonstantinou O, Ladis V, Kostaridou S, et al. The pancreas in beta-thalassemia major: MR imaging features and correlation with iron stores and glucose disturbances. EurRadio l2007; 17:1535– 1543.
- Brittenham, GM, Cohen AR, McLaren CE. Hepatic iron stores and plasma ferritin concentration in patients with sickle cell anemia and thalassemia major. Am J Hematol1993; 42: 81–85.
- Puliyel M, Sposto R, Berdoukas VA, et al. Ferritin trends do not predict changes in total body iron in patients with transfusional iron overload. Am J Hematol 2014; 89: 391-394.
- Noetzli LJ, Papudesi J, Coates TD, Wood JC. Pancreatic iron loading predicts cardiac iron loading in thalassemia major. Blood 2009; 114: 4021-4026.
- Porter JB, Walter PB, Neumayr LD. Mechanisms of plasma non-transferrin bound iron generation: insights from comparing transfused Diamond-Blackfananaemia with sickle cell and thalassaemia patients. Br J Hematol2014; 167: 692-696.
- Bayraktaroğlu S, Aydinok Y, Yildiz D, Uluer H, Savaş R, Alper H. The relationship between the myocardial T2* value and left ventricular volumetric and functional parameters in thalassemia major patients. DiagnIntervRadiol. 2011; 17:346-51.