


|
|
DOI Prefix 10.20431 |
Information
Journal Policies
Red Cell Distribution Width in Bangladeshi Children in the Diagnosis of Iron Deficiency Anemia
MD. Golam Hafiz1*, Chowdhury Yakub Jamal2, Afiqul Islam3, MD. Anwarul Karim3, ATM Atikur Rahman1, MD. Asadul Islam4, Zillur Rahman Bhuiyan5,MD. Kamrul Hasan Khan6
2 Professor and Chairman, Department of Pediatric Hematology and Oncology, Bangabandhu Sheikh Mujib Medical University, Shahbag, Dhaka, Bangladesh
3 Professor, Department of Pediatric Hematology and Oncology, Bangabandhu Sheikh Mujib Medical University, Shahbag, Dhaka, Bangladesh
4 Professor and Chairman, Department of Transfusion Medicine, Bangabandhu Sheikh Mujib Medical University, Shahbag, Dhaka, Bangladesh
5 Associate Professor, Department of Oncology, Bangabandhu Sheikh Mujib Medical University, Shahbag, Dhaka, Bangladesh
6 Professor, Department of Pathology, Bangabandhu Sheikh Mujib Medical University, Shahbag, Dhaka, Bangladesh
Copyright : © 2016 Golam MD H. This is an open access article distributed under the Creative Commons Attribution License, which permits unrestricted use, distribution, and reproduction in any medium, provided the original work is properly cited.
Abstract
Objectives: This study has evaluated the efficacy of red cell distribution width (RDW) in Bangladeshi children in the diagnosis of Iron deficiency anemia (IDA).
Materials and Methods: 145 children (6 mo-12 yrs) with microcytic (MCV < 75 fl) anemia were categorized into iron deficient (IDA) and non-iron deficient anemia (non-IDA) based on serum ferritin and total iron binding capacity (TIBC). Values of RDW were recorded from an automated hematology analyzer. Receiver operator curves (ROC) were constructed and the efficacy of RDW in the diagnosis of iron deficiency was evaluated.
Results: Mean RDW of the children was 18.56 ± 2.42% in IDA group (95 children) compared to 16.59 ± 2.49 % in non-IDA group (50 children) (p < 0.01). In IDA group, mean RDW was 16.50±1.68%, 17.75±1.71% and 21.45±1.42% in mild, moderate and severely anemic children respectively (p < 0.001). The corresponding values in non-IDA group were 16.52±1.25%, 16.45±1.20% and 16.82±2.68% respectively (p=0.275). At a cut-off value of RDW 17.9% as obtained from the ROC curve, the sensitivity and specificity of RDW in the diagnosis of IDA were 79.46% and 54.93% and a positive and negative predictive value of 59.7% and 70.2% respectively.
Conclusion: RDW, an easily available tests can be used to screen IDA with acceptably high sensitivity (79.46%) and specificity (54.93%), the cost of anemia work-up would drop considerably. So, RDW (more than 17.9%) is a strong predictor for the diagnosis of iron deficiency anemia in a large number of children at major hospitals and thereby reducing the manpower and unnecessary time consumption.
Keywords: Red cell distribution width, Iron deficiency anemia, Receiver operating curves, Bangladeshi children
Abbreviations: Red cell distribution width (RDW), Iron deficiency anemia (IDA), Receiver operating curves (ROC)
1.Introduction
Iron deficiency anemia (IDA) is the most prevalent micronutrient deficiency in the world[1]. IDA, most commonly recognized form of nutritional deficiency is prevalent among infant and young children as microcytic hypochromic anemia[2]. Despite several laboratory procedures available for its detection, mild iron deficiency is frequently undetected by haemoglobin or haematocrit method[3].
The prevalence of IDA has decreased sharply during the past two decades[4, 5]. The decline probably results from improvement in infant nutrition in general, including iron supply and particularly from increased duration of breast feeding and the introduction of iron-fortified formulas and solids [6, 7, 8]. However, IDA still remains the most common single nutrient deficiency disorder in the world and has peak prevalence among the infants, affecting as estimated 25% of all babies1. The highest rates occur in the less developed regions of the world. Furthermore, an even greater percentage of individuals of all ages reflect the biochemical changes of iron deficiency that precede the development of anemia because anemia is a late manifestation of iron deficiency. In Bangladesh, anemia is thought to prevalent among infants and young children of school going age.
Morphologically IDA is microcytic and hypochromic. Three principal techniques available for the evaluation of hypchomia and microcytosis are: calculation of erythrocytes indices, examination of stained blood smear and analysis of erythrocytes size distribution curves. With the advent of multi-parameter electronic counter, automated analysis of the blood erythrocyte indices is possible[9, 10].
With the electronic counters routinely used in large clinical laboratories, it has become practical to determine the concentration of hemoglobin (Hb) and red cell distribution width (RDW) concurrently. The red cell indices are single, mean values and cannot express the variation that may occur within the population of cells; hence they are not able to reveal the presence of a small or dual population of abnormal cells that is too small to affect the average. For this purpose, the examination of the blood smear or inspection of erythrocyte size distribution curve is essential.
The iron status of patients who were supposed to have iron deficiency (suggested dietary history, MCV <72fl, MCH <24pg, or RDW> 14.5%) was determined by measuring hemoglobin, transferrin saturation and serum ferritin11,12. Cut-off values for the laboratory test were as follows: MCV<70fl, RDW≥15%, serum ferritin level<10µg/l and transferrin saturation <12%. The diagnosis of IDA was established when children with hemoglobin level <10gm/dl and serum ferritin <10µg/l or transferrin saturation <12%, whereas patients TIBC value below 200mg/ml was excluded from IDA because it is the characteristic of inflammatory disease[12]. Microcytosis is detected on the basis of reduction in red cell diameter in comparison with small lymphocyte. An increase in the area of central pallor of erythrocyte on the blood smear is indicative of hypochromia[13, 14].
Abnormally small red blood cells (microcytosis, MCV<80fl) with or without associated anemia can arise from iron deficiency, chronic disease, hemoglobinopathy/thalassemia trait, sideroblastic anemia and lead poisoning15. Although the most common cause is iron deficiency [16, 17, it is essential to establish a definite diagnosis in view of the consequence for further analysis of the underlying disease (e.g. gastrointestinal carcinoma).
The best way to assess iron deficiency is either by quantitative appraisal of bone marrow iron storage, which is an invasive procedure or by demonstration of increase in hemoglobin concentration and MCV after iron supplementation, which is time consuming. The most commonly used parameters are serum iron concentration, total iron-binding capacity, percentage saturation of transferrin and serum ferritin concentration.
A new parameter, red cell distribution width (RDW) was described by Bessman et al.[10, 18]. With the RDW, the authors were able to differentiate accurately between two groups of microcytic anemia: those with an elevated RDW (iron deficiency, hemoglobin H disease, s-β-thalassemia) and those with a normal RDW (chronic disease, heterozygous ά-and β-thalassemia). Others, however, were not able to reproduce these results[19, 20].
The first attempt to record the mean and variation in red cell size were based on measurement of red cell diameters, and were called ‘Price Jones Curves”. With the introduction of electronic cell counters, quick construction of frequency distribution curves of red cell volume became possible. Inspection of such curves enables one to evaluate mean cell size, variation in cell size (anisocytosis) and existence of bimodal population. Most electronic counters calculate the co-efficient of variation in red cell volume and report it as “Red cell distribution width”. Normal value for adults and children is 11.5% -14.5% and for infants, 15.1-16%. Quantification of anisocytosis, as provided by the RDW seems to be valuable. RDW increases early in iron deficiency and helps to distinguish IDA from other causes of microcytic hypochromic anemias like, heterozygous thalassemia[21-23].
RDW has been proposed to be a more sensitive indicator to establish the possible origin of microcytic hypochromic anemia [24]. The RDW represents the coefficient of variation of the red blood cell volume distribution and can be considered as an index of heterogeneity, the equivalent of anisocytosis observed in the peripheral blood smear [25].
Bone marrow studies are invasive methods and serum ferritin, serum transferrin and serum iron are relatively expensive while RDW, along with other red cell indices are a part of routine blood counts in laboratories using automated hematology analyzers. If these easily available tests could be used to screen IDA with acceptably high sensitivity and specificity, the cost of anemia work-up would drop considerably because patients with a RDW suggestive of iron deficiency. Different previous studies have debated the role of RDW in diagnosis of IDA [19, 26-30], with no conclusive word on the utility of RDW in diagnosing iron deficiency anemia.
Till now to the best of our knowledge and following literature search we found no such published report on RDW in the diagnosis of iron deficiency anemia in the children of Bangladesh. So, the present study has designed to find out the utility of RDW in the diagnostic work-up of microcytic hypochromic anemias in Bangladeshi children.
2.Materials and Methods
This prospective study was carried out in the Department of Pediatric Hematology and Oncology, Bangabandhu Sheikh Mujib Medical University (BSMMU), Shahbag, Dhaka, Bangladesh during the period from January 2015 to July 2016 in one hundred (145) children of both sexes, age ranged from 6 month to 12 years with microcytic (MCV<75fl) anemia, hemoglobin<11gm/dl31.The children were considered as iron deficiency anemia (IDA) where serum ferritin <7ng/ml and /or serum total iron binding capacity (TIBC) ≥389 µg/dl32. The children those who were hospitalized and visiting the out-patient department of pediatrics at BSMMU for routine follow-up were included in the study. The children who had received iron supplements at any time over the past one month, blood transfusions over past 3 months and cases with malignancy or receiving any cytotoxic drugs within the previous 3 months were excluded from the study. Based on the following crieteria33: serum ferritin and serum TIBC; children were re-categorized as Group A: Children with iron deficiency anemia (IDA) and Group B: Children with Non- iron deficiency anemia (non-IDA).
A detailed history and clinical examination were performed following taking written consent from the parents and permission from ethical committee. Then, five ml of venous blood was collected from all selected patients. Collected blood samples were put in ethylene di-amine tetra aceitic acid (EDTA) tube for hematological studies and in plain test tube for serum iron and total iron binding capacity. The automated hematology analyzer (Sysmex XS-800i, Japan) was used to calculate various hematological parameters including RDW. Serum ferritin and serum TIBC were measured using Bench-Top Clinical Chemistry Analyzer (HumaLyzer 3000, USA). The RBC indices encompassed Hb concentration, hematocrit, MCH, MCV and RBC count. RDW plotted as a histogram was also obtained. Peripheral blood smears prepared and stained by standard techniques and examined by other hematologists who were blind to the findings of clinical examination and reports of serum ferritin, serum iron, RDW and other hematological parameters. All children with IDA were treated with oral iron (6mg/kg of elemental iron) for 8 weeks. Peripheral blood smears and hematological parameters (RDW) were repeated following treatment with oral iron therapy.
Collected raw data were organized into a statistical format and appropriate statistical analyses were done using statistical package for social science (SPSS), a software version 12.0. All continuous data were expressed as mean ± SD and the categorical data of the test in percentage (%). Paired ‘t’ test had done to compare within the parameters to observe the statistical significance. p value of less than 0.05 and confidence interval 95% were taken as the minimum level of significance.
3.Results
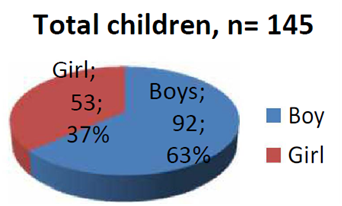
A total of 145 children (M: F=1.7:1) from aged 6 months to 12 years were included in this study. 92 (63.44%) males and 53 (36.55%) were females (Figure1).
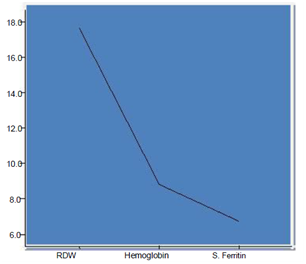
The mean age was 3.39 ±1.32 years with 31 (21.37%) children from age 6 -12 month, children between 12 month-5 years were 79 (54.48%) and 35 (24.13%) were between 5-12 years of age. Mean hemoglobin (Hb), total iron-binding capacity (TIBC), mean corpuscular volume (MCV), serum ferritin and red cell distribution width (RDW) were 8.79 ± 1.11gm/dl, 389.70 ±21.13µmol/l, 70.49± 4.10 fl, 6.74 ± 0.65ng/ml and 18.56 ± 2.42% respectively. Correlation between these parameters showed significant statistical value (p < 0.001) (Table I). We observed an inverse relationship of RDW with hemoglobin and serum ferritin which showed a statistically significant value (Figure 2).
Of these 145 children, 35 (24.13%) had mild anemia, 85 (58.62%) had moderate anemia and the rest 25 (17.24%) had severe anemia. With Group A (IDA) included 95 (65.51%) children of which 65 (68.42%) boy and 30 (31.57%) were girl with the mean age 3.39 ±1.32 years. Group B (non-IDA) included 50 (34.48%) children of which 34 (68%) boy and 16 (32%) girl with a mean age 3.3±2.7 years. No statistically significant difference was found among mild, moderate and severe anemia with respect to age and sex of children in both Group A and Group B.
The mean RDW was significantly higher in Group A (18.56±2.42 %) as compared to the Group B (16.59 ± 2.49) (p<0.001). In Group A, mean RDW with mild, moderate and severe anemia was 16.50 ± 1.68%, 17.75 ± 1.71 % and 21.45 ± 1.42% respectively. In Group B, the corresponding values were 16.52 ± 1.25 %, 16.45 ± 1.20 % and 16.82 ± 2.68 % respectively. ANOVA test showed a statistically significant increase in mean RDW with increasing severity of anemia among children with Group A (p<0.001) unlike that of Group B (p<0.275).
The sensitivity and specificity of RDW for diagnosing IDA in children between two groups were constructed from ROC where the cut-off value of RDW was 17.9% for the diagnosis of IDA. The sensitivity and specificity of RDW in the diagnosis of IDA was found 79.46% and 54.93% respectively with a positive and negative predictive value of 59.7% and 70.2% respectively (Table II).
ROC was constructed among the two groups of children with mild, moderate and severe anemia. The cut-off value of RDW for mild, moderate and severe anemia with best combination of sensitivity and specificity as obtained from these ROC curves was 16.51%, 17.63% and 19.86% respectively. The sensitivity and specificity was calculated for in mild, moderate and severe anemia was 70.2+% and 64.3%, 76.7% and 46.4% and 91.5% and 54.1% respectively.
4.Discussion
IDA is common in younger children during infancy and early childhood, when vital part of brain development occurs. Unfortunately, determination of iron deficiency in the absence of anemia in clinical practice is limited by the fact that most physicians still rely on the measurement of hemoglobin or hematocrit concentration to detect the child who is hematologicaly at risk35 to develop IDA, this is consistent to the physician of our country. In our perspective we had done RDW where it is observed an inverse relationship of RDW with hemoglobin which is consistent with the observation of Gupta et.al28.
Traditionally, even treatment and further evaluation for anemia has been reserved for individuals with hemoglobin that are below the normal range, partly because of difficulty in blood sampling in infants and young children and because of the reluctance of parents to examine. Because of the wide range of hemoglobin concentration and overlap of values in normal, non-anemic persons iron-deficient individuals hidden within the normal range of hemoglobin concentrations is probably as great as the number of iron-deficient individuals who can be recognized as anemic36. It is also consistent with our findings. In addition, when anemia is mild, the differentiation of iron deficiency from other causes of anemia becomes more difficult because the changes in the results of iron-related tests are of small magnitude and inconsistent34.
We found a significant increase in mean RDW among the children with iron deficiency anemia (18.56 ± 2.42) compared to non iron deficiency anemia group (16.59 ± 2.49 %). At a cut-off value of RDW 17.9%, as obtained from the ROC curve, the sensitivity and specificity of RDW in diagnosis of IDA were 79.46% and 54.93% respectively.
Comparing the previous published report (Table II), the present results favor the findings of Zeben et al. [26], Thompson et al. [27] and Flynn et al. [19], all of them showed a limited specificity of RDW. While Thompson et al [26] and Flynn et al [27] used serum ferritin as the inclusion criteria; Zeben et al. [26] used bone marrow iron as the gold standard where they noticed an increase in heterogeneity of RBC size (measured by RDW) is seen in all form of microcytosis. Gold standards used in our study are Hb, TIBC, MCV and Serum Ferritin. Although the increase of this parameter is quite sensitive for iron deficiency, the frequent occurrence of increased RDW in thalassemia and other conditions limits its usefulness in the initial diagnostic classification of microcytic hypochromic anemias.
The conventional examination of peripheral blood smear is time consuming and assessment is not benefit of subjective variation. The generation of RDW curve by the analyst may be useful adjunct for the diagnosis of IDA. Studies have reported the ability of RDW to distinguish IDA from other causes of anemia such thalassemia trait and anemia of chronic disease26. In our study, we endeavored to assess the efficacy of RDW in detection of anemia in comparison with hemoglobin, serum ferritin, MCV and TIBC. We observed an inverse relationship of RDW with hemoglobin and serum ferritin in our study (<0.0001) (Figure2), which is consistent with the observation of Gupta et.al28. In paired sample ‘t’ test, our observation showed a statistically significant difference between RDW and other hematological parameters (<0.0001) (Table II).
Another study done by McClure et.al.[9], where they observed 100% sensitivity of RDW and concluded that RDW isuseful in early detection of iron deficiency anemia. Bessman et.al and others observed the sensitivity of RDW to be very high (96-100%) in detecting iron deficiency anemia. We had found the sensitivity and specificity of RDW in detecting iron deficiency anemia 79.46% and 54.93% respectively which is not exactly same with the previous authors but nearly consistent with their observation.
4.Conclusion
RDW is a sensitive (79.46%) indicator in detecting or screening IDA thus aiding in early diagnosis of the children. So, RDW of more than 17.9% can be used as an effective tool for the diagnosis of IDA in a large number of samples at major hospitals thereby reducing the manpower and unnecessary time consumption.
5.Limitations of the Study
The limitation of the study is that a higher prevalence of conditions like sub clinical infections and latent inflammatory disorders in our population, unlike the Western countries can falsely raise serum ferritin levels, thereby suggesting the need to redefine acceptable normal range of serum ferritin levels among our population. This will help to fix up a higher cut-off value of serum ferritin to diagnose iron deficiency anemia in a developing country like Bangladesh.
6.Authors’ Contributions
This work was carried out in collaboration between all authors. Author MGH designed the study, wrote the protocol and interpreted data. Author CYJ anchored field study. Author AI gathered initial data. Author MAK performed preliminary data analysis. Author ATMAR performed data entry. Author MAI managed literature search. Author ZRB produced initial draft. Author MKHK performed final revision of the research paper. All authors read and approved the manuscript.
Further Suggestion
Further multicenter study with large sample size is required to establish the value of RDW in the diagnosis of iron deficiency anemia in children.
Acknowledgement
I express my sincere gratitude to our patients and the parents for their active and sincere cooperation in spite of their lot of sufferings.
Ethical Consideration
The Institutional ethical committee and review board of BSMMU approved the protocols and signed informed consent was obtained from the patients, their parents or their guardians as appropriate.
5.References
- De Maeyer E, Adiels TM. The prevalence of anemia in the world. World Health Stat Q 1985; 38:302-316.
- Cook JD. Clinical evaluation of iron deficiency. Semin Haematol 1982; 19: 6-18.
- Koeller ME, Romslo I, Finne PH, Brockmeier F, Tyssebton I. The diagnosis of iron deficiency by erythrocyte prtoporphyrin and serum ferritin analysis. Acta Pediatric Scand 1978; 67:361-366.
- Dallman PR, Yip R. Changing characteristics of childhood anemia. J Pediatr 1989; 114:161-164.
- Yip R, Walsh KM, Goldfarb MG, Binkin NJ. Declining prevalence of anemia in childhood in a middle-class setting: a pediatric success story? Pediatrics 1987; 80:330-334.
- Saarinen UM, Slimes MA, Dallman PR. Iron absorption in infants: high bioavailability of breast milk iron as indicated by the extrinsic tag method of iron absorption and by the concentration of serum ferritin. J Pediatr 1977; 91:36-39.
- Committee on Nutrition. Iron fortified infant formulas. Pediatrics 1989; 84:1114-1115.
- Dallman PR. Progress in the prevention of iron deficiency in infants. Acta Pediatr Scand 1990; 365 Suppl: 28-37.
- McClure S, Custer E, Bessman JD. Improved detection of early iron deficiency in anemia subjects. JAMA 1985; 253(7):1021-1023.
- Bessman JD, Gilmer PR, Gardner FH. Improved classification of anemia by MCV and RDW. Am J Clin Pathol 1983; 80(3):322-326.
- Dallman PR, Simes MA. Percentile curves for hemoglobin and red cell volume in infancy and childhood. J Peditr 1979; 94:26-31.
- Dallman PR, Yip R, Oski FA. Iron deficiency and related nutritional anemias. In: Nantha DG, Oski FA, editors. Hematology of infancy and childhood. 4th ed. Philadelphia: WB Saunders, 1993:413-450.
- Jen P. The value peripheral blood smear in anemic patients. Arch Int med 1983; 143:1120-1125.
- Fairbanks VF. Is peripheral blood smear reliable for the diagnosis of iron deficiency anemia? Am J Pathol 1971; 55(4):447-451.
- Steinberg MH, Dreiling BJ. Microcytosis, its significance and evaluation. JAMA 1983; 249(1):85-87.
- Cunningham LO, Rising JA. Erythrocytic microcytosis: clinical implications in 100 patients. Am J Med Sci 1977; 273(2):149-155.
- Okuno T, Chou A. The significance of small erythrocytes. Am j Clin Pathol 1975; 64:48-52.
- Bessman JD, Feinstein DI. Quantitative anisocytosis as a discriminant between iron deficiency and thalassemia minor. Blood 1979; 53(2):288-293.
- Flynn MM, Reppun TS, Bhagavan NV. Limitations of red cell distribution (RDW) in evaluation of microcytosis. Am J Clin Pathol 1986; 85(4):445-449.
- Roberts GT, Badawi SB. Red cell distribution width index in some hematologic diseases. Am J Clin Pathol 1985; 83 (2):222-226.
- Bull BS. On the distribution of red cell volume. Blood 1968; 31(4):503-515.
- Bessman JD, Johnson RK. Erythrocyte volume distribution in normal and abnormal subjects. Blood 1975; 46; 369-379.
- Okuno T. Red cell size as measured by coulter model. S J Clin Pathol 1972; 25(7):599-602.
- Romero AJ, Carbia CD, Ceballo MF, Diaz NB. Red cell distribution width (RDW): its use in the characterization of microcytic and hypochromic anemia. Medicina (B Aires) 1999:59:17-22.
- Price-Jones C. red blood cell diameter. New York. Oxford University Press Inc1933.
- Van Zeben D, Bieger R, Van Wermeskerken RK, Castel A, Herman J. Evaluation of microcytosis using serum ferritin and red blood cell distribution width. Eur J Hematol 1990; 54:106-109.
- Thompson WG, Meola T, Lipkin M Jr., Freedman ML. Red cell distribution width, mean corpuscular volume and tranferrin saturation in diagnosis of IDA. Arch Intern Med 1988; 148:2128-2130.
- Das Gupta A, Hegde C, Mistri R. Red cell distribution width as a measure of severity of iron deficiency anemia. Indian J Med Res 1994; 100:177-183.
- Viswanath D, Hedge R, Murthy V, Nagashree S, Shah R. Red cell distribution width in the diagnosis of iron deficiency anemia. Indian J Paediatr 2001; 68:1117-1119.
- Kim SK, Cheong WS, Jun YH, Choi JW, Son BK. Red blood cell indices and iron status according to feeding practices in infants and young children. Acta Padiatr 1996; 85:139-144.
- De Maeyer EM, Dallman P, Gurney JM, Hallberg L, Sood SK, Srikantia SG. Assessment, prevalence and consequence of iron deficiency anemia through primary health care. WHO Geneva 1989:7-9.
- Roosy A, Inderpreet S, Tejinder S, Naveen K. Red cell distribution width (RDW) in the diagnosis of iron deficiency with microcytic hypochromic anemia. Indian J Pediatr 2009:76(3):265-267.
- Behrman RE, Kliegman RM, Jenson HB. Reference ranges for laboratory tests and procedures. In Nelson textbook of Pediatrics 17thed.Saunders Publications, Philadelphia, 2004; 2406.
- Dallman PR, Yip R, Oski FA. Iron deficiency and related nutritional anemias. In: Nantha DG, Oski FA, editors. Hematology of infancy and childhood. 4th ed. Philadelphia: WB Saunders, 1993:413-450.
- Miller V, Swaney S, Deinard A. Impact of the WIC program on the iron status of infants. Pediatrics 1985; 75:100-105.
- Cook JD, Alvarado J, Gutnisky A, Jamara M, Labardini J, Layrisse M, Linares J, Loria A, Maspes V, Restrepo A, Reynafarje C, Medal S, Velez H and Viteri F. Nutritional deficiency and anemia in Latin America: a collaborative study. Blood 1971; 38:591-603.
- Johnson CS, Tegos C, Beutler E. Thalassemia minor: Routine erythrocyte measurements and differentiation from iron deficiency. Am J Clin Pathol 1983; 80(1):31-36.
- Marsh WL, Bishop JP, Darcy TP. Evaluation of red cell volume distribution width (RDW). Hematol Pathol 1987; 1(2):117-123.