


|
|
DOI Prefix 10.20431 |
Information
Journal Policies
Metastatic Lymph Node Ratio in the Prognosis of Esophageal Cancer
Davide Teixeira1, Claudio Branco2, Charlene Viana2, Hugo Rios3, Teresa Carneiro3, Antonio Gomes3, Dina Luis3, Sandra F. Martins1,4,5*
2.Surgery Resident - Braga Hospital, Braga, Portugal.
3.Esophagogastric Unit – Braga Hospital, Braga, Portugal.
4.ICVS/3B’s - PT Government Associate Laboratory, Braga/Guimarães, Portugal.
5.Colorectal Unit – Braga Hospital, Braga, Portugal.
Copyright : © 2018 . This is an open access article distributed under the Creative Commons Attribution License, which permits unrestricted use, distribution, and reproduction in any medium, provided the original work is properly cited.
Background: Surgery remains the treatment of choice in patients with esophageal cancer resectable disease. An adequate lymphadenectomy is crucial for correct staging.Metastatic Lymph Node Ratio (MLNR) is currently being discussed as a prognostic factor. Therefore, it is pertinent to compare the impact of MLNR versus pN category on prognosis.
Methods: Patients who underwent esophagectomy from 1/1/2000–31/12/2015 were analyzed. X-tile software was used to evaluate the MLNR cut-off points. Differences in survival were assessed using the Kaplan-Meier method and a log-rank test. To determine independent predictive power Cox regression analysis was used.
Results: Sample was composed of 88 patients. Three groups were considered: MRNL0: MRNL=0; MRNL1: 0 %< MRNL >30%; MRNL2: MRNL>30%. Univariate analyses revealed differences in the survival rates as function of the existence of relapse (p < .001), pT stage (p=.001), histological stage (p=.005), pM stage (p< .001), pN stage (p< .001) and MRNL categories (p< .001). Relapse and MRNL category were independent prognostic factors at multivariate analysis. Significant differences in the survival rates were observed among all MRL categories (p< .001). Also lower levels of MLNR were associated with longer survival times in all pT stages.
Conclusion: In this study, MLRN was a better prognostic predictor when compared to pN categories.
esophageal cancer, lymph nodes, neoplasm metastasis
1. Introduction
Esophageal cancer (EC) is the eighth most common malignant tumor worldwide, with an incidence of 456000 new cases in 2012 (3.2% of the total), and the sixth most common cause of cancer death, with an estimated 400000 deaths (4.9% of the total) [1].
Despite the many advances in EC diagnosis, staging and treatment, the survival rate remains low, between 15% and 20% at 5 years [2]. Esophagectomy remains the treatment of choice in patients with resectable disease, with several types of surgical procedures described. However, this many techniques lead to significant variability in the number of dissected lymph nodes [3].
In 2010, the 7th edition of the TNM for EC improve the N categorization; stratifying patients according to the number of metastatic lymph nodes (MLN) [3, 4]. However, this system does not specify the appropriate number of dissected lymph nodes (DLN) for an appropriate N-stage staging [4]. Patients with an inadequate number of lymph nodes examined may lead to understaging and subcategorization of the disease [3, 5]. Some studies have shown that accuracy in staging and survival in EC increases proportionally with the number of Dissected Lymph Nodes (DLN) [5-7].
The MLNR (metastatic lymph node ratio), defined as the ratio between MLN number and total number of DLN [8,9] has been shown in several studies to be an independent prognostic factor in EC [10-15]. However, few studies have evaluated whether MLRN has a greater impact on survival prognosis compared to the absolute number of MLN according to the 7th edition of the TNM staging system [8, 9], thus attenuating the possible effects of a suboptimal lymphadenectomy.
Therefore, it is crucial to evaluate and clarify the impact of the MLRN on survival prognosis compared to the pN category of the 7th edition of the TNM system.
2.Methods
The study population included patients with histological diagnosis of EC treated surgically at Braga Hospital from 01/01/2000 to 12/31/2015. Exclusion criteria were; patients undergoing surgical palliative or neoadjuvant treatment; patients whose pathological report was not possible to obtain, or in which the number of analyzed and metastatic nodes was not mentioned and patients whose death was verified up to 30 postoperative days.
The MLNR was calculated between the number of lymph nodes invaded and dissected. In order to define the cutoff points to the categorization of patients using the ratio between MLN number and DLN number, we used the X-tile software (Camp, Dolled-Filhart, &Rimm, 2004) available on the website http://medicine.yale.edu/lab/ rimm/research/software.aspx [18]. The cutoffs suggested by the mentioned software were 0 and 36, thus obtaining three categories for the ratio. For purposes of convenience of interpretation, and given the low number of sample cases at higher levels of the ratio, we chose to round off the second cut-off point to the value 30, since the differences in survival were similar considering any of these two cut-off points. Therefore, three categories as described previously.
A descriptive analysis was performed corresponding to the demographic and pathological characteristics of the patients.
Differences in survival were tested through the Kaplan-Meier method and log-rank test (univariate analysis). All variables that showed significant differences in the univariate analysis were retained and their independent predictive power tested using a Cox regression analysis (multivariate analysis).
The relationship between DLN number, MLN number and MLRN was analyzed using the Spearman correlation coefficient.
For all tests the significance level adopted was 5%, considering a significant result if p < 0.05.
This project was approved by the Subcommittee on Ethics for Life Sciences and Health and Ethics Committee for Health of the Hospital of Braga.
3. Results
Eighty-eight patients met the eligibility criteria for the study. Table 1 presents the demographic and pathological characteristics of this group of patients.
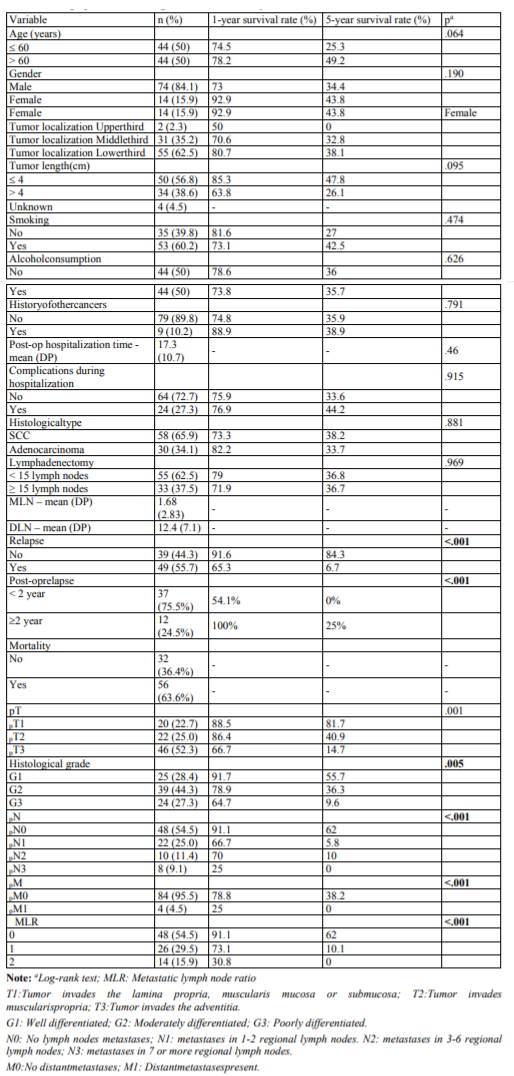
In univariate analyzes, only the existence of relapse, histological grade, pN stage, pT stage, pM stage and MLRN revealed differences in survival (Table 1). To test the predictive power of these six variables a multivariate analysis was performed, and only the existence of recurrence (p< 0.001) and MLRN (p=0.048) are independent prognostic factors.
Survival analysis showed differences between MLRN categories (p< .001), indicating that lower MLRN categories are associated with higher survival rates (Figure1).
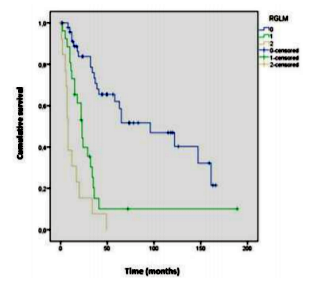
For the categories MLRN0, MLRN1, and MLRN2, the median survival was, respectively, 96, 23 and 8 months.The1and 5year survival rates for each MLRN category are described inTable1.The results of the log- rank test indicated significant survival differences between all categories: MLRN0 versus MLRN1 (χ²(1) =17.364, p< .001), MLRN0 versus MLRN2 (χ²(1) =43.789, p< .001), MLRN1 versus MLRN2 (χ²(1) =5.436,p =.02).
Table 3 presents the survival analysis results for pN categories, per pT stage. The results also show differences between pN categories at the three pT stages. However, when survival between pN categories is compared two-way (pairwise comparison), within pT2 stratum there are only differences between pN0/pN3 Regarding the pN categories, the survival analysis results also indicate significant differences (p< .001) (Figure2). Median survival was 96; 22; 20; and 6 months, respectively for pN0, pN1, pN2 and pN3. The survival rates at 1 and 5 years are documented in Table1.
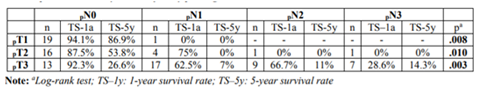
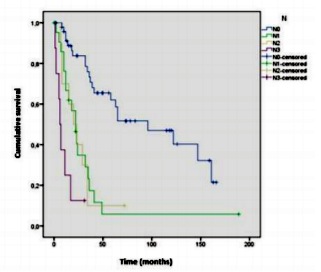
However, when the categories are compared, differences in survival were observed between pN0/pN1 (χ²(1) = 18.730, p< .001); pN0/pN2 (χ²(1) =15.225, p < .001); pN0/pN3(χ²(1) =39.431, p < .001) and pN1/pN3 (χ²(1)=5.659, p =.017). There were no differences between pN1/pN2 and pN2/pN3.
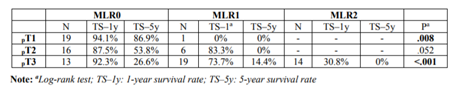
Table 2 presents the survival analysis results for the three MLRN categories when the sample is stratified by pT stage. The results indicate that, for all pT stages, lower levels of MLRN are associated with longer survival time. However, the difference between MLRN0 and MLRN1 in pT2 is only marginally significant (p=.052).
(χ²(1)=6.775, p=.009) and pN1/pN3 (χ²(1)=4.000, p=.046). Therefore, in the pT2 stratum there were no differences between pN0/pN1 (χ²(1) =1.620, p =.203); pN0/pN2 (χ²(1) = 0.814, p =.367) and pN1/pN2 (χ² (1) = 0.002, p =.967).
Within pT3 stratum, differences were found between pN0 and the remaining stages of pN (p< .05). However, no differences were found between pN1/pN2 (χ²(1) = 0.002, p =.963); pN1/pN3 (χ²(1) = 3.011, p =.083) and pN2/pN3 (χ²(1) = 2.459, p =.117).
Within pT3 stratum, differences were found between pN0 and the remaining stages of pN < .05). However, no differences were found between pN1/pN2 (χ²(1) =0.002, p =.963); pN1/pN3 (χ²(1)=3.011, p=.083) and pN2/pN3 (χ²(1)=2.459, p=.117).
No differences were found in survival between pN categories within the stratification defined by MLRN.
As seen in Figure3, the results of the Spearman correlation analysis between MLN and DLN indicates a positive relationship between both variables (rs=.301, p< .01). However, MLRN is not correlated with DLN number (rs=.194, p =.071).
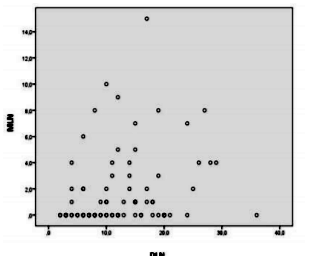
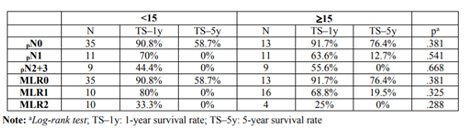
Table 4 show the results of the difference in survival between the two levels of lymphadenectomy (< 15 vs ≥15) at each pN and MLRN stage. No difference was observed between the two groups at any pN stages and for MLRN categories.
4. Discussion
Esophageal cancer is commonly associated with a poor prognosis. Its incidence increases with age, and a higher prevalence in seen in the male gender.
The squamous cell carcinoma remains as the most common histological type in the world and the lower third is the most frequently affected site [19,20]. All these epidemiological characteristics are similar to those observed in this study.
In order to diminish the effects of the inadequate staging after esophagectomy, the MLRN concept emerges as a new prognostic factor for survival [9]. However, there is still no consensus regarding the optimal cut-off values [8]. Bogoevski et al, identified MLRN as an independent prognostic factor for survival, subdividing it into four categories (0,< 11%,11% -33% and>33%) [19]. He et al, reached the same conclusions, stratifying the ratio into three categories (< 15%, 15% -30% and> 30%) [8]. However, Greenstein et al, stratifying it into three categories (≤20%,21-50% and >50%),find no differences in survival,between the last two groups [15].
This study used 3cut-off points for the ratio (MLRN0:0%,MLRN1:0.0%< MLRN≤30%,ML RN2: MLRN> 30%), obtained by the X-tile software previously used in another study with similar cut-off points (0%, 1-25% and> 25%)[9].
Firstly, we analyzed if the stratified ratio in these three categories would be a better prognostic factor than the pN categories according to the 7th edition of the TNM system.
Univariate analysis documented that the variables pT, pN, pM, histological grade, MLRN and the postoperative recurrence have an impact in terms of survival (p< 0.01). However, through multivariate analysis, only MLRN and relapse proved to be independent prognostic factors (p< 0.05).The pN category is marginally significant (p=.54). Chenetal, in a prospective study with 2011 participants with SCC, concluded that age, categories pT, pN, pM, and histologic grade were independent prognostic factors [21]. However, did not evaluate MLRN. Tan et al, regarding the same variables,with the exception of age and adding the MLRN,found that pT category and MLRN were independent prognostic factors [9]. On the other hand, He et al did not find differences regarding pTcategory [8]. The differences found in these studies may be related to the non- standardization of the inclusion criteria, as well as to the sample size. However, studies are consistent with the ratio as an independent predictor of prognosis [8, 17].
Through the analysis of the survival curves (Figure1), differences were observed among all categories of MLRN (p< .001). However, when comparing survival between the different pN stages, no differences were observed. Chen et al and He et al, using different cut-off points, found differences (p< .001). However, the same did not occur when they compare dp N2 versus pN3 [3, 8]. According to He et al, a possible explanation may be the reduced number of patients in the pN3 subgroup (n=24; 6.8%) [8]. Yang et al. and Chen et al, also did not find differences betweenp N2 and pN3, proposing a different reclassification for the pN categories [21,22].
Tan et al, using similar cutoff points (0%; 1- 25%; >25%) as our study, also found differences (p< .001) among the different categories of MLRN, unlike between pN2 vs pN3 (14).These results reinforce the importance of the MLRN, seeing that, for more advanced stages, stratification by the pN category may not be the most adequate and the ratio may have a higher prognostic potential, as found in this study.
Survival analysis of MLRN and pN categories was performed as a function of tumor invasion depth (pT), and a difference was observed in both cases. However, when survival for the pN categoriesis compared within the pT2 category, no differences were observed.These results, despite the strong limitations inherent to the sample size in some subgroups, evidenced a worse stratification of the pN categories in some pT stages, in contrast to the MLRN. There were also no differences when comparing the pN categories as a function of the MLRN. Tanet al presented similar results [1].
An adequate lymphadenectomy is crucial for correct staging in the EC [3, 8]. Peyre et al concluded that the number of DLN was an independent prognostic factor and that patients benefited with the dissection of at least 23 lymph nodes [6]. Greenstein et al, found a progressive increase in survival for the pN0 category with the increase in the number of DLN, suggesting the dissection of at least 18 lymph nodes [7].
To evaluate the impact of lymphadenectomy on survival prognosis as a function of the ratio and the pN categories, the NCCN (National Comprehensive Cancer Network (NCCN Version3. 2015) recommendations were followed,which suggest atleast the dissection of 15 lymph nodes for correct staging of post- esophagectomy patients [20]. Univariate analysis showed no difference in survival when these two groups were compared (p=.969),as well as when the various subgroups of ratios and pN categories were evaluated individually. However, the Spearman's correlation between the number of metastatic lymph nodes (MLN) and DLN numbers showed a positive relationship between both variables (rs=.301, p< .01), witch was not found with the MLRN.
Chen et al. showed that patients who were stratified according to the pN categories, those in which ≥15 lymphnodes were examined had better survival rates than those in which less than 15 were dissected, except for the pN3 category. These differences were not observed with MLRN,emphasizing the importance of this ratio for a less optimized lymphadenectomy [3].
Tan et al. demonstrated a survival benefit with a more extensive lymphadenectomy (≥15 lymph nodes examined) for the categories pN0 and pN1, but these differences are dissipated for the higher categories (pN2 + pN3). No differences were found concerning the MLRN except for a ratio equal to zero [9]. The author argues that for more advanced stages, there seems to be no benefit to a broader lymphadenectomy, in which case the ratio may be of additional importance, minimizing the effects resulting from the number of DLN. On other hand, other authors did not find differences on survival prognosis related to the extent of lymphadenectomy (< 15 versus ≥15) [8, 9].
As mentioned before,we observed a is a positive relationship between the pN categories and the DLN number but without relation with the adopted lymphadenectomy, which may be explain due to the reduced sample size.
5. Conclusion
A correct staging is crucial for an accurate prognosis of patients with EC. Literature documents the metastatic lymph node ratio as a new independent prognostic factor in EC patients. The authors concluded that MLRN was a better predictor of prognosis compared to pN categories, by stratifying the patients according to the three ratio ranges (MLRN0: 0%; MLRN1: 0.0% < MLRN≤30 MLRN2: MLRN>30%).
References
- Organization WH. Fact Sheets by Cancer [Internet]. 2012. 2012. p. 1. Available from: http://globocan.iarc.fr/Pages/fact_sheets_cancer.aspx [Accessed 28 Dec 2016].
- Oncol R, Editado C, Gentil CF. Registo Oncológico Nacional. 2008.
- Chen S-B, Weng H-R, Wang G, et al. Lymph node ratio-based staging system for esophageal squamous cell carcinoma. World J Gastroenterol. 2015; 21(2124):7514–21
- Hong SJ, Kim TJ, Lee IS, et al. New TNM Staging System for Esophageal Cancer: What Chest Radiologists Need to Know. RadioGraphics. 2014; 34(6):1722– 41.
- Altorki NK, Zhou XK, Stiles B, et al. Total number of resected lymph nodes predicts survival in esophageal cancer. Ann Surg. 2008; 248:221–226.
- Peyre CG, Hagen JA, DeMeester SR, et al. The number of lymph nodes removed predicts survival in esophageal cancer: an international study on the impact of extent of surgical resection. Ann Surg. 2008; 248:549–556.
- Greenstein AJ, Litle VR, Swanson SJ, et al. Effect of the number of lymph nodes sampled on postoperative survival of lymph node- negative esophageal cancer. Cancer. 2008; 112:1239–1246.
- He Z, Wu S, Li Q, et al. Use of the Metastatic Lymph Node Ratio to Evaluate the Prognosis of Esophageal Cancer Patients with Node Metastasis Following Radical Esophagectomy. PLoS One. 2013; 8(9):6–11.
- Tan Z, Ma G, Yang H, et al. Can lymph node ratio replace pN categories in the tumor-node- metastasis classification system for esophageal cancer? J Thorac Oncol. 2014; 9(8):1214–21.
- Hsu WH, Hsu PK, Hsieh CC, et al. The metastatic lymph node number and ratio are independent prognostic factors in esophageal cancer. J Gastrointest Surg. 2009; 13: 1913- 1920.
- Kelty CJ, Kennedy CW, Falk GL. Ratio of metastatic lymph nodes to total number of nodes dissected is prognostic for survival in esophageal carcinoma. J Thorac Oncol. 2010; 5: 1467-1471.
- Liu YP, Ma L, Wang SJ, et al. Prognostic value of lymph node metastases and lymph node ratio in esophageal squamous cell carcinoma. Eur J Surg Oncol. 2010; 36: 155-159.
- Mariette C, Piessen G, Briez N, et al. The number of metastatic lymph nodes and the ratio between metastatic and examined lymph nodes are independent prognostic factors in esophageal cancer regardless of neoadjuvant chemo radiation or lymphadenectomy extent. Ann Surg. 2008; 247:365–371.
- Bogoevski D, Onken F, Koenig A, et al. Is it time for a new TNM classification in esophageal carcinoma? Ann Surg. 2008; 247: 633-641.
- Greenstein AJ, Litle VR, Swanson SJ, et al. Prognostic significance of the number of lymph node metastases in esophageal cancer. J Am Coll Surg. 2008; 206: 239-246.
- Wijnhoven BP, Tran KT, Esterman A, Watson DI, et al. An evaluation of prognostic factors and tumor staging of resected carcinoma of the esophagus. Ann Surg. 2007; 245:717–725.
- Fox M, Farmer R, Scoggins CR, et al. Lymph node ratio is a significant predictor of disease- specific mortality in patients undergoing esophagectomy for cancer. Am Surg. 2012; 78: 528-534.
- Camp RL, Dolled-Filhart M, Rimm DL. "X- tile: a new bio-informatics tool for biomarker assessment and outcome-based cut-point optimization." Clin Canc Res. 2004; 10 (21):7252-9.
- Zhang Y. Epidemiology of esophageal cancer. World J Gastroenterol. 2013; 19(34):5598–606.
- Ajani J a B. Esophageal and esophagogastric junction cancers. JNCCN J Natl Compr Cancer Netw. 2015; 9(8):830–87.
- Chen SB, Weng HR, Wang G, et al.Prognostic factors and outcome for patients with esophageal squamous cell carcinoma underwent surgical resection alone: evaluation of the seventh edition of the American Joint Committee on Cancer staging system for esophageal squamous cell carcinoma. J Thorac Oncol. 2013; 8(4):495-501
- Yang HX, Wei JC, Xu Y, et al. Modification of nodal categories in the seventh American Joint Committee on Cancer staging system for esophageal squamous cell carcinoma in Chinese patients. Ann Thorac Surg. 2011; 92: 216–224.