


|
|
DOI Prefix 10.20431 |
Information
Journal Policies
On Determining the Volume of Repeated and Non-Repeated Sampling in the Preparation of Clinical Studies
Olga S. Kozhyna1, Oleg M. Pihnastyi2*
2.National Technical University "Kharkiv Polytechnic Institute", Kharkov, Ukraine.
Copyright : © 2019 Authors. This is an open-access article distributed under the terms of the Creative Commons Attribution License, which permits unrestricted use, distribution, and reproduction in any medium, provided the original author and source are credited.
In this article non-repeatable and repeatable sampling methods were analyzed. Main objectives connected with the use of sampling research method were determined. The problem of non-repeatable sampling amount defining at given rate of bronchial asthma prevalence was analyzed. Key preconditions and assumptions used when constructing the expression to determine the non-repeatable and repeatable sample amount were depicted.
non-repeatable sample amount, repeatable sample amount, bronchial asthma, ISAAC, research methods, statistical population feature.
1. Introduction
Bronchial asthma is one of the most common diseases of childhood [1, 2]. According to estimates of the World Health Organization, up to 180K of patients die from bronchial asthma in the world every year [7]. Numerous studies have significantly increased the understanding of bronchial asthma pathogenesis [3], use of new medications allowed to regulate the disease symptoms more effectively as well as to maintain the patients’ physical activity, but it is still impossible to solve the recovery problem fundamentally [4-6].
Over the last years incidence rates of bronchial asthma, allergic rhinitis and atopic eczema have significantly increased [8] and thus have given occasion to start up and implement the international study in accordance with standardized methods in order to improve diagnostics early in disease. Upon the recommendation of the World Health Organization the international ISAAC (International Study of Asthma and Allergy in Childhood) program, divided into IV phases [9], has been realized since 1991. The ISAAC program includes research centers in 105 countries of the world and involves two millions of children [10, 11].
In Ukraine the ISAAC research center was founded at the premises of Kharkiv National Medical University in 1997. In 1997-2002 phases I, II and III [12] have been done. Phase IV of the study is currently underway, it involves development and expansion of the ISAAC scope of application, the use of various resources to determine etiological and pathogenetic mechanisms of bronchial asthma in order to reduce the disease severity and prevalence [13, 14]. Implementation of ISAAC’s phase IV is relevant for Eastern Europe:
- Estimate the current prevalence and severity of bronchial asthma respiratory symptoms in children;
- Explore the dynamics of bronchial asthma symptomatic manifestations in children since 1998 [15, 16].
Characteristic of the Y feature of statistical population on the base of the sampling data in the amount of n [17, 18] is the final objective of the sampling observation. Let’s study the statistical population relative to quantitative feature Y in the amount of N. There is a variety of sample extraction ways. It is possible to eyeball estimate the sample amount for each way taking into account the desired accuracy level. Besides, when choosing the selection way, it is necessary to take into account relative value and time, required to implement any given sample method.
2.Characteristics Of Non-Repeatable And Repeatable Sample Methods
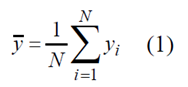
If values of Y feature are {y1, y2 ......, yN-1, yN} correspondingly, then population mean y is arithmetic mean of statistical population feature values [1, p.198]
Let’s assume that,in order to study the statistical population relative to quantitative feature Y, sample in the amount of n was extracted. Suppose the values of quantitative feature Xw of sampling population are { Xw,1,Xw,2,.....,Xw(n-1),Xw,n}, corresponding ly [1]
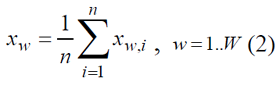
The sample mean Xw, obtained from one sample data, should be considered as a random value Xw. Thus, we may discuss the sample mean distribution as well as numeric characteristics of this distribution. Indeed, the sample can be made in a number of different ways where the quantitative feature Xw of sampling population will get values {x1, x2......, (W-1),XW}, here W is the possible number of sample variations realization.
Let there be given the range of statistical population of Y (the amount N = 3) with the values of the feature {y1=0,y2=1,y3=0}. If the sample is non-repeatable, the possible number of sample variations realization is
If the sample amount n=2 from the statistical population in the amount of N=3 we obtain
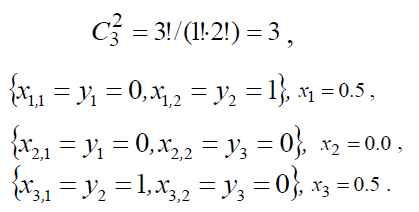
Thus, the random variate XW for the 1-st, 2-nd and 3-rd sample takes on values in accordance with the expression (2), correspondingly equal to x1=0.5, x2=0.0, x3=0.5.
If the sample method is repeatable (when yi is extracted, it’s value is fixed and got back with the possibility of another extraction) the possible number of combinations
n²=9
Thus, the selection method and the sample amount may substantially affect the study results. For this reason the selection method and the sample amount should be well-grounded. It is being understood that the sample is representative, i.e. it completely and properly represents the properties of statistical population.
Value of quantitative feature Y of statistical population is connected with the value of quantitative feature XW of sample population by means of relation [1]:
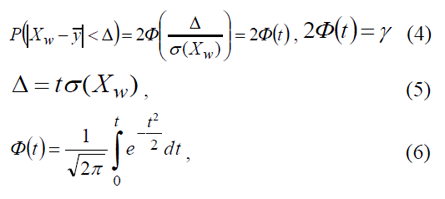
here φ(t) is Laplace’s function whose value may be taken from table [2]. Expression | XW - y -|< Δ means that deviation of the random value XW, obtained via expression (2) from arithmetical mean of the statistical population feature, does not exceed the error which is equal to Δ. This inequality can be put down as follows
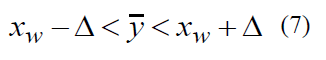
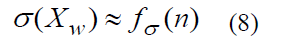
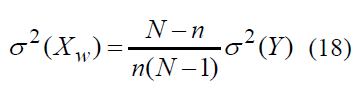
here inequality (7) has the next meaning: if the sample mean XW (2) is known, it is fair to say that, with a probability of γ, true value (1) of the statistical population quantitative feature Y falls within the limits from (XW-Δ) to (XW +Δ). Variate σ(XW) is a mean square deviation of the sample population quantitative feature XW.
Variate σ(XW) normally depends on the sample amount n
3. Main Objectives of Sample Method Use
Equation system (4) can be represented as two equations:
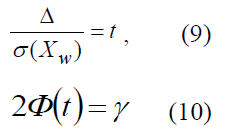
with four variables: Δ, t, σ(XW),γ. It is necessary to define two additional equations to resolve it. In this regard, there are three basic objectives appearing during the use of sampling method [2]:
Objective No1. Define the sample amount n, needed to obtain the results with required accuracy Δ at given probability γ. It is assumed that sample mean XW (2) is defined as a result of the sample implemented, while the sample population with the values { Xw,1,Xw,2..........,Xw(n-1),Xw,n} is to be obtained. Probability γ, needed the quantitative feature Y to comply the inequality (7) with the given error Δ, is known. Therewith the fact that if the given probability is γ=0.95, then in 50 cases of 1000 the inequality (7) will not be met should be taken into account. Hence, in the first objective, among four variables Δ, t,σ(XW),γ the given ones are Δ,γ (and correspondingly t) and γ(XW) is to be defined and allowing us to obtain the sample amount n.
Objective No2. Define the possible nonsampling error limit, ensuring the results with the given probability, and compare it with the acceptable error. It is assumed that the sample amount n and the probability γ, meeting the relation (7) requirements, are given. Error Δ should be defined and compared with acceptable error to perform experiments. When setting up the problem the probability γ(or t ), sample amount n (σ(XW) accordingly) are considered as given and the error value Δ should be defined.
Objective No3. Define the probability that the sample error will not exceed acceptable error. In this case the sample amount n and error Δ are given. The probability that the sample error will not exceed acceptable error is to be defined. When setting up the problem the probability γ (or compliant with it t parameter), sample amount n (σ(XW) accordingly) are considered to be known. It is necessary to define the probability γ that the sample error will not exceed acceptable error Δ.
4. Theoretical Foundations Of Non-Repeatable And Repeatable Sample Amount Calculations In The Preparation Of Clinical Studies
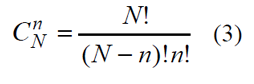
In the case of non-repeatable method of amount n elements selection, taken from the general population N for checkup, the general number of possible samples can be defined by combinatorial formula (3). Let us assume that the method of amount n elements extraction is such that each sample from the general number (3) has equal probability of being selected. This is a random sample method. As it was already mentioned the selected element is not to get back into the statistical population.
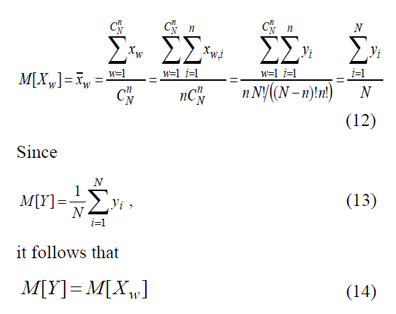
Sampling mean X-W
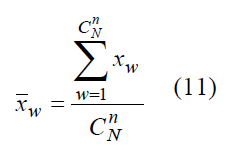
of a random value XW is an unbiased estimator of mean value y (1) for population Y :
Variance of random variable XW can be defined via expression
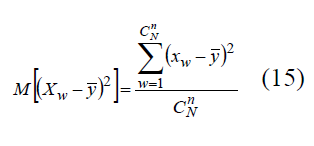
Substituting XW into (15), let us put down
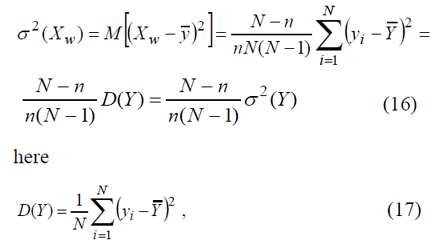
Formula (16) can be used to calculate mean square deviation of random variable XW
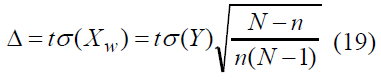
Taking into account formulae (4–6) let us obtain relationship of error Δ , probability γ and sample amount n
Let us put the last equality to the next form
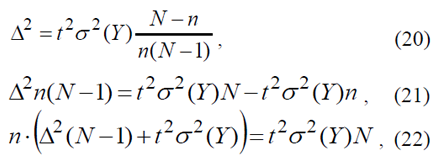
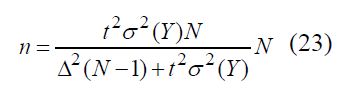
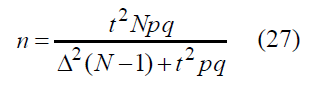
allowing to obtain sample amount n through error Δ and t parameter, compliant with probability γ
If a random value Y has binomial distribution with expectation function
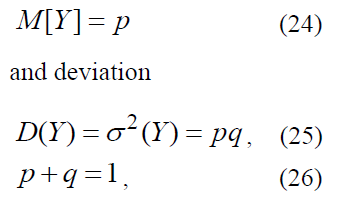
then formula (23) looks like:
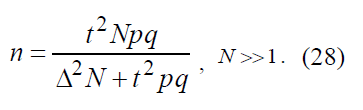
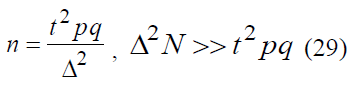
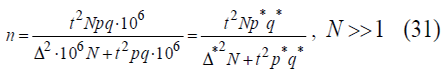
In the most of real-world cases amount of statistical population is much greater than one: N >>1. This helps us to obtain the final equation
When Δ²N >> t² Pq this equation is simplified to
In medical research it is comfortable to use alternative values of p*, q* = 1000-p*, Δ*, expressed in permille and related as follows:
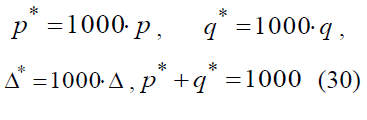
Let’s multiply the numerator and denominator of the equation (28) by 106 to obtain
From now forth let us suppress the symbol (*) during calculations assuming that the corresponding dimension is given.
5. Definition of Sample Amount N In Non-Repeatableand Repeatable Sample
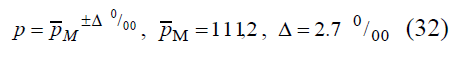
Let us estimate the amount of sample necessary for phase IV of ISAAC study implementation in Ukraine (Eastern Europe). Statistical population relative to quantitative feature of asthma incidence rate Y in the amount of N = 89736 is being studied. The rate of bronchial asthma prevalence in Ukraine in accordance with official data is
here PM is the mean prevalence of asthma incidence in Ukraine in permille. Equation (32) is possible to be put down in another form (figure 1):
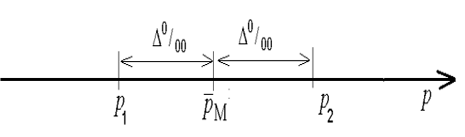
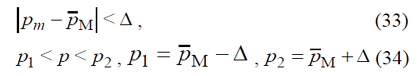
here p is the rate of bronchial asthma prevalence in Ukraine. It should be mentioned that this variate is unknown. However, we can affirm that it can be defined via inequality (34) with reliability 2φ(t)= γ= 0.95. The point of given reliability is in the fact that if sufficient number of samples is implemented then 95% of the samples will define sample’s confidential intervals P1W, P2W, including the rate of bronchial asthma prevalence in Ukraine p.
p1W < p < p2W
Only in 5% of cases the rate of bronchial asthma prevalence p can exceed the sample’s confidential intervals P1W, P2W. In view of the fact that the rate of bronchial asthma prevalence p is unknown, and we know only that it is between P1 and P2 (34), we can assume that the required amount of nonrepeatable sample n is also in the interval
nmin < n < nmax
with the limits of nmin, nmaxdefined via relation
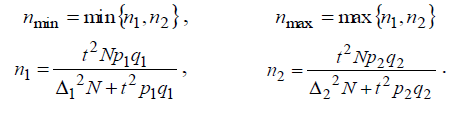
Let us take maximum value of n = nmax as the sample amount value. Let us get sample amount for the data in (32):
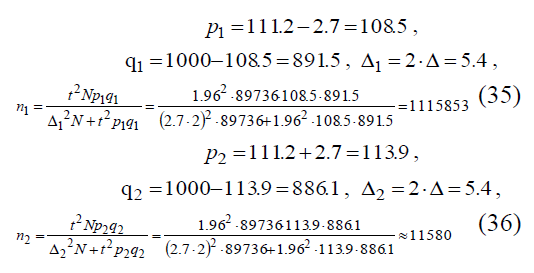
Let’s select the maximum value n=11580.42≡11581 of two values n1, n2 . During calculations it was assumed that the sample we used had the rate of bronchial asthma prevalence PW within the limits (34) of P1 < PW < P2. Then, assuming PW = P1, maximum possible deviation between the sample’s mean PW and the rate of bronchial asthma prevalence p if P = P2 is equal to
|PW - P| = |P1- P2| = 2.Δ = Δ 1
This value was used in calculations (figure.2). The same steps help us to obtain
|PW - P| = |P2- P1| = 2.Δ = Δ 2
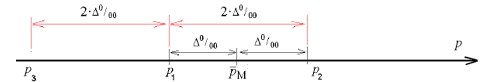
if PW = P2 (figure.3).
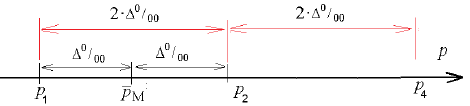
In calculations of the sample amount the error Δ1 = 2Δ was used. It twice exceeds the error for the rate of bronchial asthma prevalence in Ukraine. Its structure may look like
Δ 1 = Δ w + Δ, Δ 2 = Δ w + Δ
here resultant errors Δ1 , Δ2 contain sample error ΔW and error Δ , used in obtaining the rate of bronchial asthma prevalence (32). For this purpose we assumed that both errors were equal ΔW = Δ.
6. Conclusions
Calculation of sample population amount for representativeness of received data is one of the first and the key moments of the studies oriented to true characteristics of investigated pathology definition and its analysis. In this article repeatable and non-repeatable sample methods were analyzed to reveal reliable information on prevalence of bronchial asthma respiratory symptoms during questioning in accordance with standardized methods of ISAAC. The main objectives connected with the use of sampling research method were investigated. Theoretical foundations were demonstrated and dependence of required sample amount on statistical population value N , required accuracy Δ of the received results with the given probability γ was explained. Objective of non-repeatable sample amount definition with the given rate of bronchial asthma prevalence was analyzed. Key preconditions and assumptions used when constructing the expression to determine the sample amount were depicted.
References
- Global Initiative for Asthma (GINA): Global strategy for asthma management and prevention /Update 2014 and Online Appendix. –2014. – available: http:// www. ginasthma.org.
- Papadopoulos N.G., Arakawa H., Carlsen K. H. [et al.] / International consensus on (ICON) pediatric asthma // Allergy. – 2012. –Vol. 67, №8.–P.976–997. https://doi.org/10.1111/j.1398 -9995.2012.02 865.x
- Holgate S. T. Мechanisms of asthma and implications for its prevention and treatment: a personal journey // Allergy Asthma Immunol. Res. – 2013. – Posted online 2013. https:// doi. org/10.4168/aair.2013.5.6.343
- GINA Report. / Global Strategy for Asthma Management and Prevention. - 2018. –available: https://ginasthma.org/2018-gina-report-global-strategy-for-asthma-management-and-prevention/ Global atlas of asthma.
- Nalina N., Chandra M.R. / Assessment of quality of life in bronchial asthma patients // International Journal of Medicine and Public Health. – 2015. – Vol. 5, N 1. – Р.93-97. – https://doi.org/10.4103/2230-8598.151270
- Hossny, E. Severe asthma and quality of life / E. Hossny, L. Caraballo, T. Casale, Y. El-Gamal, L. Rosenwasser // World Allergy Organ. -2017; 10(1): 28. - Published online 2017 Aug 21. https://doi.org/ 10.1186/s40413-017-0159-y
- World Health Organization -2018. –available: http://www.who.int/ru/news-room/fact-sheets /detail/asthma/
- Hansen T. E., Evjenth B., Holt J. Increasing prevalence of asthma, allergic rhino conjunctivitis and eczema among school children: three surveys during the period 1985– 2008 // Foundation Acta Paediatrica. – 2013. – Vol. 102. – P. 47–52. –https://doi.org//10.1111 /apa.12030
- ISAAC. The International Study of Asthma and Allergies in Childhood /New Zealand: The University of Auckland. – 2012. –available: http://isaac.auckland.ac.nz/.
- [10] Lai C. K .W., Beasley R., Crane J., Foliaki S., Shah J., Weiland S., the ISAAC Phase Three Study Group/Global variation in the prevalence and severity of asthma symptoms: Phase Three of the International Study of Asthma and Allergies in Childhood (ISAAC) // Thorax . – 2009 March. -Vol. 64, N 6. https://doi.org//10. 1136/thx.2008.106609
- Pearce N., Beasley R., Mallol J., Keil U., Mitchell E., Robertson and the ISAAC Phase Three Study Group / Worldwide trends in the prevalence of asthma symptoms: phase III of the International Study of Asthma and Allergies in Childhood (ISAAC) // Thorax. - 2007 – Vol. 62. – P.758–766. https://doi.org//10.1136/thx. 2006.070169
- Ognev V.A. Asthma and Allergy Epidemiology in Children// Kharkiv: Shhedra Usad’ba Pljus. – 2015 - 43.
- Tischer C.G., Hohmann C., Thiering E., Herbarth O.,Muller A., Henderson J., et al. Meta-analysis of mould and dampness exposure on asthma and allergy in eight European birth cohorts: an ENRIECO initiative // Allergy. – 2011 –Vol. 66, №12 – P.1570–1579. https:// doi.org//10.1111/j.1398-9995.2011. 02712.x.
- Wennergren G., Ekerljung L., Alm B., Eriksson J., Lotvall J., Lundback B. Asthma in late adolescence--farm childhood is protective and the prevalence increase has levelled off // Pediatr Allergy Immunol. –2010 –Vol. 21, – №5 –P. 806–813. https://doi.org//10.1111 / j.1399-3038.2010.0107.7.x
- Klymenko V.A., Karpushenko Y.V., Kozhyna O.S. Time course of symptomatic manifestations in children with bronchial asthma residing in Kharkiv region according to the ISAAC study // Inter Collegas.- 2018 –Vol.5, №2 – P.69-72
- Kozhyna O.S. Effect of Ecological Factors on Respiratory Diseases Manifestation // Child’s Health. –Vol.13, –№5, –p.88–92. https://doi. org//10.22141/2224-0551.13.5.2018.141561
- Gnurman V.E. Theory of Probability and Mathematical Statistics– Moscow: Vysshaja shkola, 1972. – 368 p.
- Vencel E.S. Theory of Probability and its Engineering Application –Москва: Moscow: Vysshaja shkola, 2000. –480 p.