


|
|
DOI Prefix 10.20431 |
Information
Journal Policies
Visualizing Topic Burst and Citation Comparisons among Clusters of Medical Subject Headings on Anesthesiology: Bibliometric Analyses
Tsair-Wei Chien1, Wei-Chih Kan2,3, Hsien-Yi Wang1, Willy Chou4,5*
2.Nephrology Department, Chi-Mei Medical Center, Tainan, Taiwan
3.Department of Biological Science and Technology, Chung Hwa University of Medical Technology, Tainan, Taiwan
4.Department of physical medicine and rehabilitation, Chi Mei medical center, Tainan, Taiwan
5.Department of Recreation and Health-Care Management & Institute of recreation Industry Management, Chia Nan University of Pharmacy, Tainan, Taiwan
Copyright : © 2018 Authors. This is an open-access article distributed under the terms of the Creative Commons Attribution License, which permits unrestricted use, distribution, and reproduction in any medium, provided the original author and source are credited.
Background: In the last few decades, social network analysis (SNA) has been widely applied to visualize author collaboration characteristics in academics and report the results of citation analyses. None was applied using SNA on medical subject headings (MeSH terms) to inspect the topics and compare the citations for a given journal or discipline.
Objective: To visualize the current state of research onpublication outputs and citations in the field of anesthesiology to uncover topic burst and citations among MeSH clusters.
Methods: Selecting 1,526 abstracts, author names, countries, and MeSH trems on August 20, 2018, from Pubmed Central (PMC) based on the journal of anesthesiology (JOA) in years from 2012 to 2016, we proposed a novel h-plus index that can effectively complement and efficiently improve the h-index for calculating the MeSH-type bibliometric indices in PMC. Four topics were addressed: (1) which nations was dominant in the field of anesthesiology; (2) which MeSH terms were cited most by papers in PMC; (3)is any difference in scientometrics among MeSH clusters;(4)which article was cited most in the past. We programmed Microsoft Excel VBA routines to extract data. Google Maps and Pajek software were used for displaying graphical representations.
Results: We found that (1)the dominant nation on the topic of anesthesiology is the US; (2)the MeSH terms of methods and analysis gain the top metrics in h-plus index(6.15) and impact factor(IF)(12.51), respectively; (3)differences are found significantly among MeSH clusters on scientometrics(p< 0.05); (4) the article(PMID=22487805) published in 2012 was cited most(with 20 times and a single MeSH term of methods).
Conclusions: Social network analysis provides wide and deep insight into the relationships among MeSH terms. The MeSH weighted scheme and h-lus index can be applied to academics for computing MeSH citations in the future.
h-plus index, medical subject headings, Google Maps, social network analysis, anesthesiology, bibliometric analysis, Anesthesiology
Anesthesiology is regarding the medical specialty of anesthesia or anesthetics[1]. As stated by the American Society of Anesthesiologists, anesthesiology is the practice of medicine dedicated to the relief of pain and total care of the surgical patient before, during and after surgery [2]. Anesthesia is defined as the loss of sensation with or without the loss of consciousness.
As of August 20, 2018, more than 189,516 papers were published on Pubmed. Comby searching the keyword anesthesiology and 3,222 in the paper title including anesthesiology, which present the importance of author collaborations in academics in the past. On the journal perspective, the Journal of Anesthesiology (JOA) has published 23,224 articles since 1987. The most-cited authorshave been reported [3]. The topic burst in recent years on anesthesiology is still unknown.
Given the importance of anesthesiology, manyscientific researchers[4-6] have focused on reviewing related literature to identify the characteristics and status of anesthesiology in recent years. However, much of these effortswereonly considering specific subfields of anesthesiology, with conclusions being drawn from descriptive analysis and systematic reviews. Even some [7,8] have conducted citation analyses on articles related to anesthesiology;none reports topic burst incorporated with citations on anesthesiology untill now.
Papers on the bibliometric perspective of anesthesiology research can provide readers with methods of analyzing data of scientific literature quantitatively and then gain knowledge of the meta-information related to the research in question [9,10]. The combined use of methodologies that give information on different aspects of scientific output is generally recommended [11]. In addition, discussion relating to the collaborative status and overall topic burst on anesthesiologystill remains relatively scarce.
We are thus interested in following four topics in this study:(1) which nations was dominant in the field of anesthesiology; (2) which medical subject headings(MeSH) were cited most by papers in recent years; (3)is any difference in scientometricsamong MeSH clusters;(4)which article was cited most in the past.
We aim to apply h-plus index that can effectively improve the h-index [12] in bibliometric analyses [13,14] and investigate the four questions mentioned above.Google Maps will be applied to the study results as dashboards in an interactive way.
2. Methods
We programmed Microsoft Excel VBA (visual basic for applications) modules to extract abstracts and their corresponding coauthor namesas well as the countries/areas of the firstauthors for each article on August 20, 2018, from Pubmed Central (PMC) based on the journal of anesthesiology (JOA) from 2012 to 2016.Only those abstracts published by the keyword anesthesiology [journal] and labeled with Journal Article were included. Others like those labeledwith Published Erratum, Editorial or without author nation name were excluded from this study. A total of1, 526 eligible abstracts were obtainedfrom PMC.
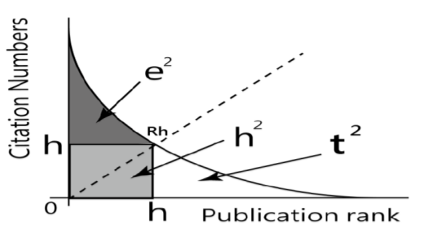
Referring to the L-index[15] , where ai as the number of authors of i-th publication(i.e., equal size to coauthors) and yi as the length of i-th publications measured by the year, like other indices mentioned above, such as h-index[12], h’-index[13,14], g-index[16], and x-index[17], assumed all coauthors contributing equally with a weight(=1.0) in an article byline. We define the MeSH weighted scheme as for citations and publications, respectively, where n=number of articles, ci, and pi as citations and publications on the i-th article. The h’-index [13] (=h*rh=eh/th in Figure 1)is problematic due to being greater than h+1(e.g., both h=2 and rh =2 make h’-index be 4 greater than 3(=2+1= h+1)). Another h-plus index proposed in this study is also derived from both fundamental parts (i.e., eh and th as Equation. (1) ranged between h and h+1), see Figure 1[14].
h-plus = h +rh/ (1+rh), (1)
Author impact factor (AIF) [18] is applied to MeSH impact factor (named MIF for short) as Equation.2:
MIF = { Σ Cited papers based on Wi / Σ Citable papers X Wi in the given yrs } = { weighted citations / weighted publications } , (2)
The weighted publications are set at 1.0 if the values< 1.0 for avoiding the AIF inflated too much.
In keeping with the Pajek guidelines [19] using social network analysis (SNA), we defined a MeSH term as a node (or an actor) that is connected to another counterpart at another node through the edge of a line. Usually, another weight is defined by the number of connections between two nodes.
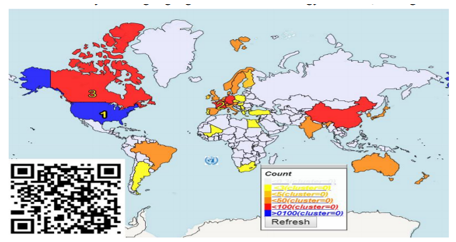
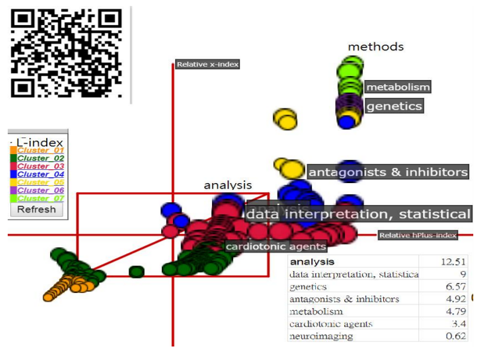
A visual display with the publication outputs labeled by the1st author nationswas made forpresenting the distribution of nationson anesthesiology. The quantity is colored by the size of publications. The most cited MeSH terms sized by MIF and colored by L-index were shown based on both axes (i.e., x-index on the x-axis and h-plus index on the y-axis),
SNA was applied to determine the representative for each cluster. The algorithm of community partition was performed to identify the clusters. Each MeSH was assigned to the cluster represented by the MeSH which was similar to the author analysis being highlighted with the highest degree centrality in the cluster. As such, each MeSH contributes equally proportional parts (i.e., 1/n) in an article and then can be matched to the respective metrics and clusters.
The bootstrapping method [20] was applied to examine differences in metrics among MeSH clusters. A total of 1000 medians retrieved from the median of the 100 random cased were used to estimate the 95% confidence intervals (CI) for a metric of a given cluster. As such, the difference can be determined by judging the two 95% CI bands separated from each other.
We appliedthe author-made modules in MS-Excel and the SNA in Pajek to gain the MeSH clusters. The pages of Hyper Text Mark-upLanguage(HTML) used for Google Maps were created.All relevant bibliometric indices were linked to dashboards on Google Maps.
3. Results
Thedominant nation on the topic of anesthesiology is the US, see Figure 2.
The MeSH terms of methods and analysis gain the top metrics in the h-plus index(6.15) and impact factor(IF)(12.51), respectively. Interested readers are invited to scan the QR-Code in Figure 3 to see the MeSH terms regarding relevant outputs in PMC by clicking the specific MeSH bobble.
The top 10 MeSH clusters were separated as shown in Figure 4. The representatives with the most degree centrality (DC) are shown for each cluster. The term of psychology earns the highest DC, implying the methods with high frequency sized by the bubble. The interested readers are also recommended to scan the QR-coed in Figure 4 to see the detailed information in PMC by clicking the word of publication when the specific MeSH bubble is selected.
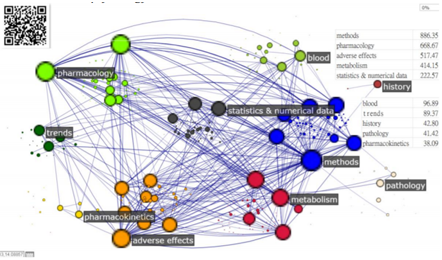
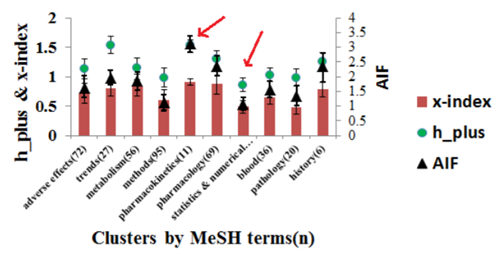
The differences in metrics (i.e., h-plus, x-index, andMIF) were found (p< .05); see Figure 5, when any two 95% CI bands were separatedfrom each other. The representative ofpharmacokinetics places the top one in these three indices among MeSH clusters. In contrast, the MeSH term of statistics & numerical data ranks the bottom in metrics among clusters.
The article (PMID=22487805) entitled -Awake fiber optic or awake video laryngoscopic tracheal intubation in patients with anticipated difficult airway management: a randomized clinical trial -in 2012 was cited most (with 20 times and a single MeSH term of methods) [21].
4. Discussion
We found that (1)the dominant nation on the topic of anesthesiology is the US; (2)the MeSH terms of methods and analysis gain the top metrics in h-plus index(6.15) and impact factor(IF)(12.51), respectively; (3)differences are found significantly among MeSH clusters on scientometrics (p< 0.05); (4) the article (PMID=22487805) published in 2012 was cited most(with 20 times and a single MeSH term of methods)[21].
Although the h-index[12]being a popular author-level metric that can measure both the productivity and citation impact of the publications of a scientist, one of its shortcomings is less discriminative power[22] due to many with identical value in an f integer unit. Many concepts of bibliometrics have already been proposed in the past [12-18], but we have not seen any that can be applied to the scientific disciplines in use successfully. We propose the one as an h-plus index that can effectively improve h-index with high discriminative power for evaluating authors or MeSH terms as we did in this study.
We demonstrated the usage of the h-plusindex in JOA by using the MWS for quantifying contributions among MeSH terms in an article byline, which was never seen in literature before. In Figure 3, we see the MeSH-based x-indexes an h-plus index shown on a dashboard using Google Maps that can be recommended to authors for use in the future. The bibliometric indices are dependent on the quantity (i.e., the number of publications) and the quality (i.e., the number of articles being cited), which is suitable for use in journal topics like we did in this study. In comparison to the author-based bibliometrics [3], the MeSH-based metrics gain higher values than the author indices because of a huge amount of frequency relatively occurred in the past five years. On the Figures 3 and 4, it is easy to see the topic burst regarding anesthesiology in the past.
Similarly, the x-index [17] on anesthesiology in Figure 3 will be higher than (or equal to) the h (or h-plus) index due to the inclusion of excessive citations, see Figure 1. For instance, ten publications with ten citations each have an identical h-index and x-index at 10(or √10*10 for x-index). In contrast, One publication with 100 citations leads to a difference in h-index (=1) and x-index (=10=√1*100), and 100 publications with only one citation each have different results in h-index (=1) and x-index (=10=√100*1) [17]. The h-plus index as proposed in this study might havea high correlation, theoretically, with x-index than h-index.
The most worth-noting feature is the generalMWSfully congruent with the true scenario in practice. That is, the contributions were determined by the weights (=1/n) instead of all with an identical value (=1) no matter the ordering of MeSH terms.
The second feature is the intrinsic dynamic character of the simple 5-year moving average MIFs, like the journal citation report(JCR) locating JIF each year in June, to examine the change of MIF(or h-plus index). Unlike the h-index, which is a growing measure taking into account the whole career path [18].
The reason we applied x-indexin this study is the strength of the index in practice. According to the illustration in the study of Fenner and his colleagues [17], the x-index can truly extend the feature of an author with quality and quantity achievements in academics as mentioned above.
Although findings are based on the above analysis, there are still several potential limitations that may encourage further research efforts. First, all data were extracted from the PubMed database. There might be some biases of understanding the matched MeSH terms because of some different terms with the asterisk represented by major MeSH in the article, which will affect the result of MeSH relationship analysis by the accuracy of the indexing MeSH terms.
Second, many algorithms havebeen used for SNA. We merely applied the algorithm of degree centrality in the Figures. Any changes in the algorithm used in this study might present a different pattern and judgment to the results.
Third, the data extracted from PMC cannot be generalized to other major citation databases— such as the Scientific Citation Index (SCI; Thomson Reuters, New York, NY, USA) and Scopus (Elsevier, Amsterdam, The Netherlands). Such as the most cited authors are determined by the paper selections on Pubmed.
In conclusion, social network analysis provides wide and deep insight into the relationships among MeSH terms. The MeSH weighted scheme and h-plus indexcan be applied to academics for computing MeSH citations in the future.
References
- Wang HY, Chien TW, Chow JC, Chou W*.Applying Clustering Coefficient to the Pattern of International Author Collaboration in Anesthesiology.ARC Journal of Anesthesiology 2017; 2(3), 18-24.
- American Society of Anesthesiologists. What is Anesthesiology? 2017/12/20 available at https: //goo.gl/nAxpXd
- Kan WC, Chien TW, Wang HY, Chou W. The most highly-cited authors and papers on the topic of anesthesiology from 2012 to 2016 in Pubmed Central (PMC).ARC Journal of Anesthesiology2018; 3(3): 13-18.
- Bisgaard CH, Rubak SLM, Rodt SA, Petersen JAK, MusaeusP. The effects of graduate competency-based education and mastery learning on patient care and return on investment: a narrative review of basic anesthetic procedures. BMC Med Educ. 2018 Jun 28; 18(1):154.
- Kynes JM, Walters CB, Pinto E, Jeque E, McQueen KAK.A profile of surgical burden and anaesthesia services at Mozambique's Central Hospital: A review.nt J Surg. 2018 Jun;54(Pt A):285-289.
- CohenSL, Mason KP, SaxenMA.Literature Review for Office-Based Anesthesia. AnesthProg. 2018 spring; 65(1):66-68.
- Pagel PS, HudetzJA.An analysis of scholarly productivity in United States academic anaesthesiologists by citation bibliometrics. Anaesthesia. 2011 Oct;66(10):873-8
- Pagel PS, HudetzJA. Scholarly productivity of United States academic cardiothoracic anesthesiologists: influence of fellowship accreditation and transesophageal echo cardiographic credentials on h-index and other citation bibliometrics. JCardiothorac Vasc Anesth. 2011 Oct; 25(5):761-5.
- Shen L, Xiong B, Li W, Lan F, Evans R, Zhang W.Visualizing Collaboration Characteristics and Topic Burst on International Mobile Health Research: Bibliometric Analysis. JMIRM health Uhealth. 2018 Jun 5; 6(6):e135.
- Pritchard A. Statistical bibliography or bibliometrics? J Doc. 1969 Jan; 25(4):348–349.
- Van Leeuwen T, Visser M, Moed H, Nederhof T, Van Raan A. The Holy Grail of science policy: exploring and combining bibliometric tools in search of scientific excellence. Scientometrics. 2003 Jun; 57(2):257–280. doi: 10.1023/A:1024141819302.
- Hirsch JE. An index to quantify an individual's scientific research output. Proc Natl Acad Sci USA 2005;102:16569-72.
- Zhang CT. The h’-Index, Effectively Improving the h-Index Based on the Citation Distribution. PLoS ONE 2013; 8(4): e59912.
- Zhang CT. The e-index, complementing the h-index for excess citations. The e-index, complementing the h-index for excess citations. PLoS One 2009;4(5):e5429.
- Belikov AV, Belikov VV. A citation-based, author- and age-normalized, logarithmic index for evaluation of individual researchers independently of publication counts. F1000 Research 2015, 4:884
- Egghe L. Theory and practice of the g-index. Scientometrics 2006; 69:131-15Lindsey D. Further evidence for adjusting for multiple authorship. Scientometrics. 1982; 4(5): 389–395.
- Fenner T, Harris M, Levene M, Bar-Ilan J. A novel bibliometric index with a simple geometric interpretation. PLoS One. 2018; 13(7):e0200098.
- Pan RK, Fortunato S.Author Impact Factor: tracking the dynamics of individual scientific impact. Sci Rep. 2014; 4:4880.
- BatageljV, MrvarA.Pajek - Analysis, and Visualization of Large Networks. inJünger, M., Mutzel, P., (Eds.) pp.77-103. Graph Drawing Software, Springer, Berlin, 2003.
- Efron B. Bootstrap methods: Another look at the jackknife. The Annals of Statistics 1979; 7(1): 1-26.
- Rosenstock CV, Thøgersen B, Afshari A, Christensen AL, Eriksen C, Gätke MR. Awake fiberoptic or awake video laryngoscopic tracheal intubation in patients with anticipated difficult airway management: a randomized clinical trial.Anesthesiology. 2012 Jun; 116(6):1210-6.
- Huang MH, Chi PS. A comparative analysis of the application of h-index, g-index, and a-index in institutional-level research evaluation. Journal of Library and Information Studies 2010; 8(2):1-10.