


|
|
DOI Prefix 10.20431 |
Information
Journal Policies
The Most Highly-Cited Authors and Papers on the Topic of Anesthesiology from 2012 to 2016 in PubMed Central (PMC)
Wei-ChihKan1,3, Tsair-Wei Chien3, Hsien-Yi Wang1, Willy Chou4,5*
2.Department of Biological Science and Technology, Chung Hwa University of Medical Technology, Tainan, Taiwan
3.Research Department, Chi-Mei Medical Center, Tainan, Taiwan
4.Department of physical medicine and rehabilitation, Chi Mei medical center, Tainan, Taiwan
5.Department of Recreation and Health-Care Management & Institute of recreation, Industry Management, Chia Nan University of Pharmacy, Tainan, Taiwan
Copyright : © 2018 Authors. This is an open-access article distributed under the terms of the Creative Commons Attribution License, which permits unrestricted use, distribution, and reproduction in any medium, provided the original author and source are credited.
Objective: To evaluate individual research achievements (IRA) and collaborations in anesthesiology from 2012 to 2016.
Methods: Selecting 1,526 abstracts, author names, countries, and keywords on August 20, 2018, from Medline based on the journal of anesthesiology (JOA) in years from 2012 to 2016, we proposed an authorship-weighted scheme (AWS) for quantifying coauthor contributions and calculating their bibliometric indices in PubMed Central (PMC). Four main topics were addressed: (1) which article was cited most by papers; (2) which journals cited most to JOA; (3)which author in JOA earns the highest h-index and x-index; (4) what are the x-indexes for JOA and countries/areas. We programmed Microsoft Excel VBA routines to extract data. Google Maps and Pajek software were used for displaying graphical representations.
Results: We found that (1) the paper (PMID: 22487805) was cited by 20 papers since 2012; (2) the journals of PLoS One and Anesthesiology cited most articles in JOA with citing degree centralities (2478 and 2007) in 2017; (3) the author Eliana Lucchinetti from Canada has the highest academic achievement (i.e. x-index=5.51) in JOA; (4) the x-indexes for JOA and the U.S. are 41.86 and 28.56, respectively.
Conclusion: Social network analysis provides wide and deep insight into the relationships among nations and coauthor collaborations. The AWS can be applied to academics for computing individual research achievements in the future.
Authorship weighted scheme, authorship collaboration, Google Maps, social network analysis, ophthalmology, bibliometric index, Anesthesiology
Anesthesiology describes the medical specialty concerned with the study of anesthesia or anesthetics[1]. The American Society of Anesthesiologists defines anesthesiology as "the practice of medicine dedicated to the relief of pain and total care of the surgical patient before, during and after surgery"[2]. Anesthesia is the loss of sensation with or without the loss of consciousness.
As of August 20, 2018, more than 189,516 papers were found on Pubmed. Comby searching for the keyword anesthesiology and 3, 222 in the paper title only including anesthesiology. The Journal of Anesthesiology has published 23, 224 articles since 1987. However, who is the most-highly-cited author in recent years is still unknown.
Big Data is a concept that has evolved from the modern trend of "scientism" [3]. Many data scientists’ develop ways to discover new knowledge from the vast quantities of increasingly available information [3]. The famous apocryphal story was often told to tell us about the concept of co-occurrence that is about beer and diaper sales [4-6]. However, it has not attracted much more intentions from academics until several articles related to social network analysis (SNA) were published in the literature [7-9].
The number of research papers with multiple authors [10] has increased considerably because knowledge discovery no longer occurs solely in local university departments but now exists across international academic institutes [11]. The increasing academic pressures and the spotlight on individuals with prolific publications let many researchers seek to claim authorship of a paper [10]. However, the individual scientific achievement is not form the publication outputs but from the number of cited papers[12]. Sekercioglu in 2008[13] addressed the importance of quantifying coauthor contributions. The real numbers instead of traditional integral digits affect the computation of bibliometric indices in practice. The most widespread approach includes the use of the so-called h-index [12]and the author impact factor (AIF) [14,15] which are limited to the cited number with integrals only.
Even many counting schemes were proposed for quantifying coauthor contributions[16-21], there is no any application in practice except for the two [7,8] published in the literature. We were interested in applying the authorship-weighted scheme (AWS) [7,8] to explore several issues in anesthesiology such as (1) which articles and journals cited most and (2) which authors are earning the highest h-index and x-index [22].
Our aims are to apply AWS to explore (1) which article was cited most by papers; (2) which journals cited most to JOA; (3) which author in anesthesiology earns the highest h-index and x-index; (4) what are the x-indexes for the journal of anesthesiology (JOA) and the countries/areas.
2. Methods
We programmed Microsoft Excel VBA (visualbasic for applications) modules to extract abstracts and their corresponding co author names as well as the countries/areas of the first authors for each article on August 20, 2018, from Medicine National Institutes of Health (Medline) in years between 2012 and 2016. This is because the journal citation report (JCR) published journal impact factors in 2017 including the preceding two or more years. Only those abstracts published by the keyword anesthesiology [journal] and labeled with Journal Article were included. Others like those labeled with Published Erratum, Editorial or without author nation name were excluded from this study. A total of 1, 526 eligible abstracts were obtained from PubMed Central (PMC).
According to the previous articles [7,8] releasing the AWS as the Equation(1):
The sum of authorships equals 1 for each paper. We applied it to calculate coauthor contributions. This is the proportion of credits in an article byline. The 5-year author impact factor (AIF) can be obtained by the equation (2):
papers (denoted by ci) for each article are descended and endorsed by integrals from 1 to n [22] in 2017 based on citable papers in PMC since 2012. All bibliometric indices were located on dashboards using SNA and Google Maps to display, see the next two sections.
The rule for applying author weights to calculate h-index is defined as below:
h=cm+ (h-1)/10 for h-core if max (ci) < 1 and (2) h= h + the decimal if max (ci)>=1, where cm= the maximal proportional citation weights (i.e., max (ci) across all ci for an individual authors.
In keeping with the Pajek guidelines [23] using SNA, we defined an author as a node (or an actor) that is connected to another counterpart at another node through the edge of a line. Usually, another weight is defined by the number of connections between two nodes.
A table (i.e., columns for publication years and rows for the 1st author nations) was made for presenting the distribution of nations regrading anesthesiology. The bigger bubble means, the number of the nodes. The wider line indicates the stronger relations between two nodes. Community clusters are filled with different colors in bubbles.
Google Maps [24] and SNA Pajek software[23] were used to display visualized representations for eminent authors in relation with anesthesiology. Author-made Excel VBA modules were applied to organize data. Cluster coefficient represents the density of a network. Two-way ANOVA was performed to analyze the comparison of author x-index among continents and the years from 2012 to 2016.
3. Results
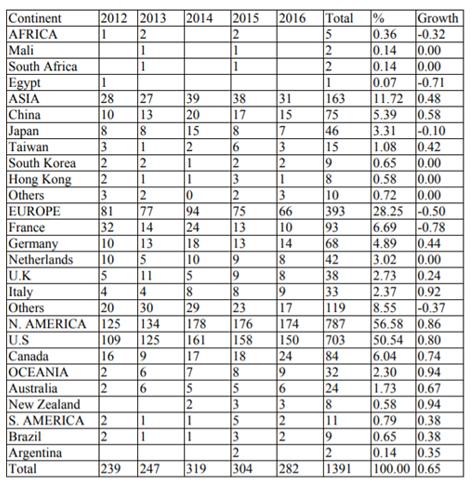
A total of 1, 526 eligible papers were analyzed in Table 1. We can see that the most number of papers are from the U.S. (703, 50.54 %) and France (93, 6.69%). The trend of publications for the U.S. is increasing (corr. = 0.80), but decreasing for France (corr. = -0.78). All continents have at least one country that published papers in JOA in the past five years.
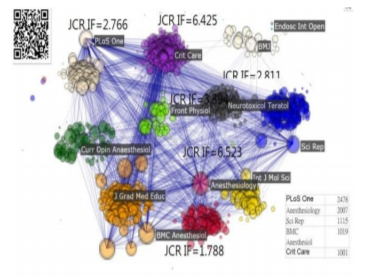
The paper (PMID: 22487805) [25] was cited by 20 papers since 2012. The first author Rosen stock from Denmark has already published 42 papers in PMC. The diagrams regarding the cited journals to JOA are shown in Figure 1. From which, we can see that the Journal of PLoS One cited the most number of articles in JOA in the years from 2012 to 2016. Interested authors are suggested to scan the QR-code to see the details on Google Maps.
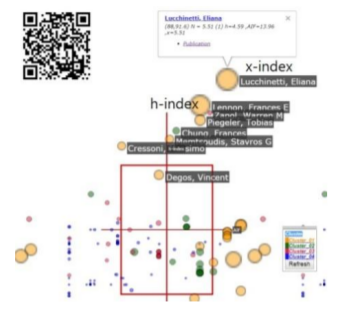
The most-highly cited author for JOA is Eliana Lucchinetti from Canada who has the highest academic achievement (i.e. x-index=5.51) in JOA. The details about the authors’ bibliometric indices are linked to the dashboard on Google Maps. Interested readers are suggested to scan the QR-code on Figure 2 and see the specific author for the research achievement in JOA. We demonstrated the AWS-based bibliometric indices displaying all authors on Google Maps in comparison in Figure 2.
We computed the x-indexes among countries/areas for JOA authors shown in Figure 3. The x-indexes for JOA and the U.S. are 41.86 and 28.56, respectively. Other countries/areas with top x-index values are shown at the left-bottom part in Figure 3.
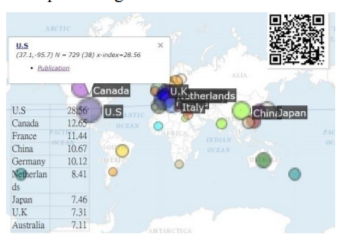
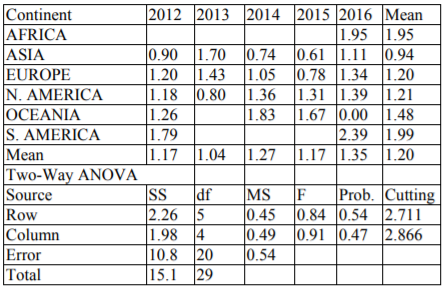
Table 2 shows the comparison of author x-indexes among continents over the years from 2012 to 2016. The two-way ANOVA was performed to report that no any difference was found among continents (p=0.54) and years (p=0.47).
4. Discussion
We found that (1) the paper (PMID: 22487805) was cited by 20 papers since 2012; (2) the journals of PLoS One and Anesthesiology cited most articles in JOA with citing degree centralities (2478 and 2007) in 2017; (3) the author Eliana Lucchinetti from Canada has the highest academic achievement (ie. x-index=5.51) in JOA; (4) the x-indexes for JOA and the U.S. are 41.86 and 28.56, respectively.
Although the h-index [12], a popular author-level metric, can measure both the productivity and citation impact of the publications of a scientist, one of its short comings is the assumption of equal credits for all coauthors in an article [13,16].
Many concepts of individual research achievements have already been proposed in the past [16-21], but we are not aware of any empirical study that can successfully solve the problem of quantifying coauthor contributions [13] in the empirical discipline.
Even Vavryčuk [26] proposed a combined weighted counting scheme in 2018, the authorship-weighted scheme has not been applied to academics and used in practice so far for authors in comparison on Google Maps. These results from Figures in this study made it clear about the author (or journal) contributions to a specific journal, such as the JOA in this study).
The h-index has been criticized for its usage in disciplines. We demonstrated the usage of h-index in JOA by using the AWS for quantifying coauthor contributions. In Table 2, we see the author-based x-indexes are lower less than 2.0. It is because the bibliometric indices dependent on the quantity (i.e., the number of publications) and the quality (i.e., the number of articles being cited) make the author-based indices pretty low. That is, the number of the cited papers is very hard to reach a huge number of citation in these five years. In contrast, the x-index for the journal of anesthesiology or the counties/areas can be easily higher than the author-based indices due to the significant difference in the length of the cited papers.
The most worth-noting feature is the general AWS fully congruent with the category probability theory based on the Rasch rating scale model (RSM) [27]. We can adjust the parameters (i.e., the base and the power) to accommodate many types of situations or scenarios in practice. Hence, Vavryčuk’s combined weighted scheme [26] (or the harmonic credits [28]) is a special case of the general AWS in Eq.1.
The second feature is the intrinsic dynamic character of the simple 5-year moving average AIFs, like the journal citation report(JCR) locating JIF each year in June, to examine the change of author’s AIF (or h-index). Unlike the h-index, which is a growing measure taking into account the whole career path [15].
The reason we applied x-index in this study is the strength of the index in practice. According to the illustration in the study of Fenner and his colleagues [22], the -index can truly extend the feature of an author with quality and quantity achievements in academics. For instance, if one author has a single publication with 100 citations and another has ten publications each with ten citations, then the h-index of the former is one while the h-index of the latter is 10. At the other extreme, an author with 100 publications, each with a single citation, has an h-index of 1.If x-index was applied, all those examples mentioned above would reach an identical value of 10 for measuring the individual research achievement.
Although findings are based on the above analysis, there are still several potential limitations that may encourage further research efforts. First, all data were linked to the PubMed database. There might be some biases of understanding the matched authors because some different authors with the same name or abbreviation exist, who are affiliated with different institutions. Therefore, the result of author relationship analysis would be influenced by the accuracy of the indexing author.
Second, many algorithms have been used for SNA. We merely applied the algorithm of degree centrality in the Figures. Any changes in the algorithm used in this study might present a different pattern and judgment to the results. Similarly, the formula, Eq.1, used in this study is also a special case of the general AWS model. Any change for the parameters might present a different AIF or h-index and judgment to the results.
Third, the assumption of corresponding (or supervisory) authors being the last authors might be challenged, especially in computing AIFs. Any parameters changed in our proposed formula will affect the author contribution weights and the AIFs (or h-index) in results.
Fourth, the data extracted from PMC cannot be generalized to other major citation databases— such as the Scientific Citation Index (SCI; Thomson Reuters, New York, NY, USA) and Scopus (Elsevier, Amsterdam, The Netherlands). Such as the most cited authors are determined by the paper selections on PubMed.
In conclusion, the h-index (or other modified indices) incorporated with SNA shown on Google Maps provide insight into the relationships between citable and cited achievements for authors. The AWS-based indices can be applied to other academic fields for understanding the most highly cited authors in a discipline.
References
- Wang HY, Chien TW, Chow JC, Chou W*. Applying Clustering Coefficient to the Pattern of International Author Collaboration in Anesthesiology.ARC Journal of Anesthesiology 2017; 2(3), 18-24.
- American Society of Anesthesiologists. What is Anesthesiology? 2017/12/20 available at https://goo.gl/nAxpXd
- Morris MA, Saboury B, Burkett B, Gao J, Siege lEL. Reinventing Radiology: Big Data and the Future of Medical Imaging. J Thorac Imaging. 2018 Jan; 33(1):4-16.
- Domingos p. A few useful things to know about machine learning. Communications of the ACM2012; 55:10, 78-87.
- Verhoef PC, Kooge E, Walk N. Creating Value with Big Data Analytics: Making Smarter Marketing Decisions. London: Routledge, 2016.
- Power DJ. What is the "true story" about data mining, beer and diapers? DSS News. 2018/820 available at http://dssresources.com/faq/index. php?action=artikel&id=41
- Chien TW, Chow JC, Chang Y, Chou W. Applying Gini coefficient to evaluate the author research domains associated with the ordering of author names: A bibliometric study. Medicine. 2018; 97(39): e12418
- Chien TW, Wang HY, Chang Y, KanWC. Using Google Maps to display the pattern of coauthor collaborations on the topic of schizophrenia: A systematic review between 1937 and 2017. Schizophr Res. 2018;. pii: S0920-9964(18)305 73-5.
- Chien TW, Chang Y, Wang HY. Understanding the productive author who published papers in medicine using National Health Insurance Database: A systematic review and meta-analysis. Medicine. 2018; 97(8):e9967.
- Avula J, Avula H. Authors, authorship order, the moving finger writes. J Indian SocPeriodontol. 2015 May-Jun; 19(3):258-62.
- Gibbons M, Limoges C, Nowotny H, Schwartzman S, Scott P, Trow M. The new production of knowledge: the dynamics of science and research in contemporary societies. London: Sage, 1994.
- Hirsch JE. An index to quantify an individual's scientific research output. Proc Natl Acad Sci USA 2005; 102: 16569-72.
- Sekercioglu CH. Quantifying coauthor contributions. Science 2008; 322 (5900): 371.
- Lippi G, Mattiuzzi C. Scientist impact factor (SIF): a new metric for improving scientists' evaluation? Ann Transl Med. 2017 Aug; 5(15):303.
- Pan RK, Fortunato S. Author Impact Factor: tracking the dynamics of individual scientific impact. Sci Rep. 2014; 4:4880.
- Petersen AM, Fortunato S, Pan RK3, Kaski K, Penner O, Rungi A, Riccaboni M, Stanley HE, Pammolli F. Reputation and impact in academic careers. Proc Natl AcadSci U S A. 2014; 111(43): 15316-21.
- Batista PD, Campiteli MG, Kinouchi O. Is it possible to compare researchers with different scientific interests?” Scientometrics 2006; 68 (1): 179–189.
- Lindsey D. Further evidence for adjusting for multiple authorship. Scientometrics. 1982; 4(5): 389–395.
- Egghe L, Rousseau R, Van Hooydonk G. Methods for accrediting publications to authors or countries: Consequences for evaluation studies. J Am Soc Inform Sci. 2000; 51(2):145– 157.
- Tscharntke T, Hochberg ME, Rand TA, Resh VH, Krauss J. Author sequence and credit for contributions in multi authored publications. PLOS Biology. 2007; 5(1): e18
- Waltman L. A review of the literature on citation impact indicators. 2015. arXiv: 1507.02099.
- Fenner T, Harris M, Levene M, Bar-Ilan J. A novel bibliometric index with a simple geometric interpretation. PLoS One. 2018; 13(7): e0200098.
- BatageljV, MrvarA. Pajek - Analysis, and Visualization of Large Networks. InJünger, M., Mutzel, P., (Eds.) pp.77-103. Graph Drawing Software, Springer, Berlin, 2003.
- Phan TG, Beare R, Chen J, Clissold B, Ly J, Singhal S, Ma H, Srikanth V. Googling Service Boundaries for Endovascular Clot Retrieval Hub Hospitals in a Metropolitan Setting: Proof of-Concept Study. Stroke. 2017; 48(5):1353-1361.
- Rosenstock CV, Thøgersen B, Afshari A, Christensen AL, Eriksen C, Gätke MR. Awake fiberoptic or awake video laryngoscopic tracheal intubation in patients with anticipated difficult airway management: a randomized clinical trial. Anesthesiology. 2012; 116(6):12 10-6.
- Vavryčuk V. Fair ranking of researchers and research teams. PLoS One. 2018 Apr 5; 13(4): e0195509.
- Andrich D.A rating scale formulation for ordered response categories. Psychometrika, 1978; 43, 561-573.
- Hagen NT. Harmonic allocation of authorship credit: source-level correction of bibliometric bias assures accurate publication and citation analysis. PLoS One. 2008; 3(12):e4021.