


|
|
DOI Prefix 10.20431 |
Information
Journal Policies
Correlation between Ramsay Sedation Scale and Richmond Agitation-Sedation Scale with Bispectral Index Monıtoring in the Intensive Care Unit
Oner Erdogan1, M. Gura Celik2, Hasan Kocoglu2*, Yagmur Ustun3
2.Prof. Dr., Istanbul Medeniyet University, Faculty of Medicine, Department of Anesthesiology and Reanimation,Istanbul, Turkey.
3.Resident, Istanbul Medeniyet University Goztepe Education and Research Hospital, Anesthesiology and Reanimation Clinic, Istanbul, Turkey.
Copyright : © 2018 . This is an open access article distributed under the Creative Commons Attribution License, which permits unrestricted use, distribution, and reproduction in any medium, provided the original work is properly cited.
Background: Achieving appropriate sedation levels in mechanically ventilated patients is very crucial in intensive care units. Reaching and keeping appropriate level of sedation in these patients is a common problem. By reaching appropriate sedation and analgesia, comfort and easier adoption to weaning is aimed. For adequate and appropriate sedation, monitoring the sedation level is needed. Different scoring techniques are used for this purpose. Our aim is to compare Bispectral index (BIS) monitoring, which is an objective method, with subjective clinical sedation scales, and to investigate the correlation between them.
Methods: Data of patients, whom sedation and mechanical ventilation were performed in postoperative period, were analysed retrospectively. All patients with comorbidities which cause altered brain function and who needed inotropic drugs were excluded from the study. Richmond Sedation Scale (RSS) levels were held between +2 - +3, and Richmond Agitation Sedation Scale (RASS), BIS and hemodynamic parameters were recorded in every hour for 6 hours.
Results: A negative correlation between BIS and clinical sedation scales was observed in patients who had superficial sedation. RASS levels ranged from 0 to “-3”, and average BIS value was 75. The average BIS value at RAMSAY +2 was 79 and 74 at RAMSAY +3. For RASS, average BIS level was 64 at RASS -3, 75 at RASS -2, 79 at RASS -1 and 83 at RASS 0. The probability of having a RAMSAY score of 3 was 3,785 times higher in cases with a BIS level of 77 or less.
Conclusions: As a result, objective assessment criteria are required in patients with mechanically ventilated and sedated patients in intensive care unit. While superficial sedation values may be the function of subjective clinical sedation scales such as RSS and RASS, more effective use of BIS monitoring is needed in cases where deep sedation is performed.
Keywords: Sedation, Ramsay Sedation Scale, Richmond Agitation Sedation Scale, Bispectral index, Mechanical ventilation.
1. Background
Sedating the mechanically ventilated patients in intensive care unit (ICU) has a clinical prevalence, and aimed to reduce incompatibility with the ventilator, to increase intubation tolerance, to reduce anxiety, reducing recall of intensive care, reduce stress response and oxygen consumption, prevent removal of endotracheal tube, vascular catheter etc. by patients, to increase the adequacy of patient care services, to provide good conditions for sleep of patients, protect patient care providers from the patient's agitating movements, to treat delirium [1-4]. The application of sedation at the desired level is one of the major problems encountered in these patients. A number of methods have been defined to keep sedation levels in an appropriate range. It is a known fact that there are various complications in cases where the proper sedation condition can not be provided, and that there are prolonged ICU stay [5]. In addition, the sedation depth has a clinical prescription for patient-based adjustment. Various scales have been defined for sedation evaluation. The level of sedation in these scales is measured and monitored by different methods. In the clinical practice some objective (measurement of plasma concentration of sedative, frontal electromyogram, lower esophageal contractility, electroencephalogram, bispectral index (BIS) monitoring, auditory evoked potentials) and subjective methods (Ramsay Sedation Scale (RSS), Motor activity scale, Richmond Agitation Sedation Scale (RASS), clinical scoring systems such as Riker Sedation-Agitation Scale) are used for this purpose [2,6]. RSS has six levels (Level 1; anxious, agitated, restless, Level 2; cooperative, oriented, tranquil, Level 3; responsive to commands only, Level 4; brisk response to light glabellar tap or loud auditory stimulus, Level 5; sluggish response to light glabellar tap or loud auditory stimulus, Level 6; no response to light glabellar tap or loud auditory stimulus), and although it was formulated long time ago it is still frequently used in all over the world [6]. The RASS is a 10 point scale, and has criteria for levels of sedation and agitation (+4 Combative , +3 Very agitated, +2 Agitated, +1 Restless, 0 Alert and calm, −1 Drowsy, −2 Light sedation, −3 Moderate sedation, −4 Deep sedation, −5 Unarousable) [7-9]. BIS is a numeric value ranging from '0' to '100', 100 representing normal cortical electrical activity, and 0 indicating cortical electrical silence. This figure is obtained from the mathematical analysis of the electroencephalogram. With the increase of sedation and hypnosis, the BIS value decreases. The range 100-86 reflects awakeness, between 85-66 means sedation, 65 to 41 value means general anesthesia and deep hypnosis , and the level of 40 reflects near suppression. Values below 20 indicate burst suppression in the EEG When the BIS index drops below 60, the patient is unlikely to be conscious [5,10,11].
There are studies in the literature investigating the effectiveness of different sedation scales. However it is stil difficult to maintain and sustain sedation at the most appropriate level, and there is no accepted gold standard about the method for sedation in mechanically ventilated patients in intensive care units. We aimed in this study to retrospectively investigate whether there is a correlation between Ramsay Sedation Scale and Richmond Agitation Sedation Scale with Bispectral Index Monitoring aplied for detection of level of sedation in mechanically ventilated and sedated patients in our intensive care unit.
2. Methods
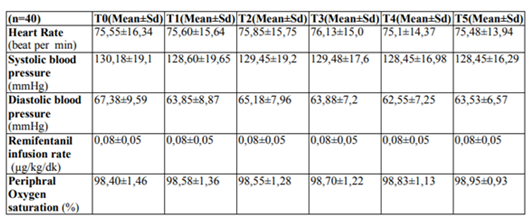
Following the approval of the ethics committee (Istanbul Medeniyet University Göztepe Education and Research Hospital Ethical Approval Number: 2016/0038), files and computer records of patients who had been machanically ventilated for 6 hours postoperatively in our third degree intensive care unit, sedated by using remifentanil (0,05-0,2 μg / kg / min), and BIS monitoring had been applied were retrospectively reviewed. Demographic data of the patients were recorded. Patients' Ramsay Sedation Scale, Richmond Agitation-Sedation Scale, Bispectral Index Score, peripheral arterial oxygen saturation (oxygen percent saturation), heart rate, blood pressure (systolic and diastolic), sedation agent infusion rate were noted at one hour intervals (T0, T1, T2, T3, T4 and T5).
BIS values and Richmond scales were analysed for correlation with Ramsay scores of +2 and +3. Patients who had received sedative agent other than remifentanil, had inotropic support, could not completed the study follow-up period, had central nervous system disease, and patients having Ramsay score of <2 and >3 were excluded from the study. BIS monitoring was applied using "Vista Monitoring System" (Vista, Aspect Medical Systems, Norwood, USA). The monitor is connected to the interface cable and the BIS sensor. The BIS sensor was placed from the left side of the frontal region of the patients to the left temporal region. BIS monitoring was provided after the 'signal quality index' (SQI) indicator was confirmed by one of the windows opened from the display monitor. With the monitor we used, the BIS score was automatically and continuously recorded.
NCSS (Number Cruncher Statistical System) 2007 (Kaysville, Utah, USA) program was used for statistical analysis. Student's t test was used to compare two groups of variables with normal distribution when comparing descriptive statistical methods (mean, standard deviation, median, frequency, ratio, minimum, maximum) as well as quantitative data. The one-way ANOVA welch test was used in the comparison of the groups with the normal distribution and the "Games-Howell Test" was used to determine the group causing the difference. "Repeated Measures Test" was used for intra-group comparisons of normal distribution variables. The "Friedman Test" was used for intra-group comparison of the variables with no normal distribution, and the "Wilcoxon Signed Ranks Test" was used for the evaluation of the binary comparisons. Spearman correlation analysis was used in evaluating inter-variable correlations. Diagnostic screening tests and "ROC Curve" analysis were used to determine "cut off" for the parameters. Significance was evaluated at p <0.01 and p <0.05.
3.Results
Data of 40 patients were studied totally, twenty-one (52.5%) were female and 19 (47.5%) were male, and the ages ranged from 39 to 92 years with an average of 65.65 ± 13.08 years. Chronic obstructive pulmonary disease was detected in the hystory of 7 (17.5%) cases, diabetes mellitus in 14 (35%), coronary artery disease in 11 (27.5%), hypertension in 20 (50%), and chronic renal failure in 6 (15%) patients. Fifteen patients (37.5%) had Ramsay score of 2, and 25 (62.5%) patients had Ramsay score of 3 in T0, T1, T2, T3, T4 and T5 measurements, and the RASS values ranged from -3 to 0 with an average of -1.65 ± 0.77 at these measurements.Remifentanil infusion rates were noted as 0.05 to 0.2 µg / kg / min (mean 0.08 ± 0.05 μg / kg / min). There was no statistically significant difference in hemodynamic variables and peripheral arterial oxygen saturation values in measurement times (p> 0.05) (Table 1).
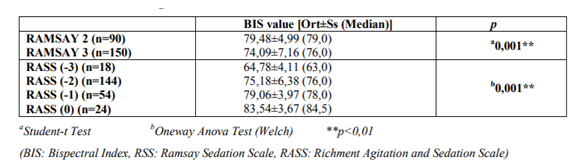
BIS values of patients with a RAMSAY score of 2 were found to be significantly higher than those with a RAMSAY score of 3 (p < 0.01). There was a statistically significant difference between the BIS values of the cases according to RASS scores (p <0,01). According to the results of the Games-Howell test to determine the difference, BIS values of RASS score-3 were significantly lower than those of RASS score -2, -1 and 0 (p <0,01). BIS values of RASS score -2 were significantly lower than those of RASS score -1 and 0 (p < 0,01). Likewise, the BIS value of RASS score -1 was significantly lower than the RASS score of 0 (p < 0,01)(Table 2).
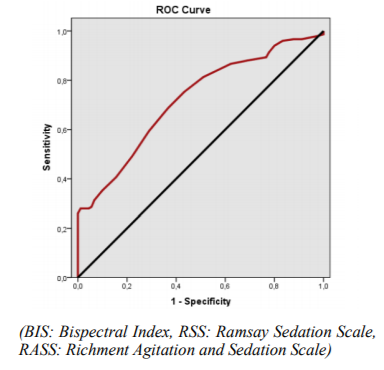
For the cut-off value of the BIS level 77; sensitivity was 68.67%; specificity was 63.33%; positive predictive value was 75,70 and negative predictive value was 54,80. In the obtained ROC curve, the underlying area was 72.1% and the standard error was 3.3% (Figure 1). Statistically significant correlation was found between RAMSAY scores and 77 cut-off values of BIS level (p < 0,01). The probability of having a RAMSAY score of 3 was 3,785 times higher in cases with a BIS level of 77 or less. The odds ratio for BIS was obtained as 3,785 (95% CI: 2,183-6,563).
4. Discussion
BIS monitoring is an objective method compared to clinical scales in the evaluation of sedation, and allows patient-based sedation. The BIS index values reflect the reduced cerebral metabolic rate induced by the hypnotic agents used. Hemodynamic changes are intensified, analgesia and sedation needs are usually long-term, and the pharmacokinetic and pharmacodynamic properties of the drugs are different in intensive care patients. It is emphasized that BIS values may change in critically ill patients, therefore, BIS characteristics and target values may change in anesthesia applications and intensive care applications [12,13]. G. Consales et al. [5] studied 40 patients who were sedated with propofol and midazolam after major abdominal and vascular surgery. Unresponsive patient with RSS 6 was preferred as the desired sedation level at that study, and the corresponding BIS index was found to be 32-68. It has been emphasized that optimal sedation agent titration can be achieved with BIS, and BIS is a suitable monitoring method for patients under deep sedation, and excessive sedation and related complications can be prevented by BIS [5]. In a study involving 24 patients by Karamchandani et al. [14], it was emphasized that RASS is the ideal sedation scale, especially in patients who undergo mechanical ventilation, because these patients need sedation in mild and moderate levels, and the RASS values ranged from 0 to -3 with an average BIS value of 56 (42-89) in that study. Berkenbosch et al. [12] found the sensitivity to be 87% without discriminating between adequate and insufficient sedation at BIS value <70. Gu et al. [15] applied BIS monitoring to 30 intensive care patients who needed postoperative mechanical ventilation support, and assessed the correlation between them and RSS. When the depth of sedation increased, the RSS values were increased and simultaneously the BIS index was observed to decrease, and a negative correlation was determined between BIS and RSS. Our target in our study was +2 and +3 in RSS and average BIS value was obtained as 75 in these values. This suggests that high RSS values correlate with low BIS values, suggesting that clinical sedation monitoring scales may be used in patients having light sedation.
Subjective scales and BIS monitoring show differences in patients under deep sedation and in agitated patients. Patients under deep sedation may become deeper once they have achieved the lowest score on clinical evaluation, and this deepening can be measured by BIS monitoring even the clinical scoring is insufficient. On the other hand, when the patient is completely awake and the BIS index is 100, the patient may be agitated up to the dangerous levels. Clinical assessments may better define the patient in this situation. In our study we did not observe dangerous agitation values in any of the patients when the values of the Richmond Agitation Sedation Scale of the patients were examined with RSS values of +2 and +3.
One reason for the inconsistency between a subjective scoring and BIS is the timing of BIS measurement. For clinical evaluations, patients are stimulated with verbal or painful stimuli and scored. During this stimulation, BIS values can rise from 50 to 80-90 [16]. It significantly changes the correlation assessment of the clinical scoring of the measured BIS value before or after stimulation [17]. We evaluated baseline BIS values recorded without stimulus in our study, and then evaluated clinical sedation scores. Thus, we measured the baseline BIS values of patients presenting sedentary conditions and assessed the correlation as such. We evaluated only remifentanil infused patients to ensure that there were no stimuli that could cause pain to the patient. Muscle relaxant delivery significantly reduces the BIS index and electromyogram(EMG) activity. Influence of BIS index value on EMG may be caused by inadequate sedation assessment by clinicians and excessive sedation applications. We did not include patients who had had muscle relaxing agents in our study.
It has been reported previously that the use of BIS has resulted in less sedative drug use and therefore lower drug costs. It has also been shown that patients have four times less recall of negative intensive care experience [16]. Kato et al. [18] studied compared patients sedated by remifentanil and the other group of patients using fentanyl and propofol for sedation. The Richmond agitation-sedation scale was selected as the sedation scale at their study which correlated with the BIS. A maximum infusion of 0.2 μg/kg/min was used in the remifentanil group. Propofol infusion (1-3 μg/kg/h) was administered to the control group following bolus fentanyl administration. In the remifentanil group BIS and RASS was found to be correlated with each other, but no correlation was found between the two in the other group [18]. We also evaluated patients using remifentanil infusion to achieve sedation in our study, and found a correlation between RASS and BIS.
In a study conducted by Yaman et al. [19], it was aimed to investigate the correlation between BIS and the four most commonly used sedation scales in patients who require mechanical ventilation in sedentary intensive care units. In addition, the response status of the existing scales to varying BIS values was assessed. The RSS, RASS, the sedation agitation scale (SAS) and the intensive care environment adaptation scale (ATICE) were selected. There were no significant differences in mean arterial pressure, heart rate, and peripheral oxygen saturation during the study period. Following initial sedation, BIS scores decreased and remained low relative to baseline. In the scales, a significant decrease in the RASS value was observed when the RSS increased. The highest correlation of BIS in that study was found with RSS, and the lowest scale was determined with ATICE. [19]. Herrero et al [20] compared different methods in the assessment of postoperative neurological complications in neurosurgical patients, and reported that; applied together, the assessment of pupils, Glasgow, Coma Scale, RSS, CNS, The Nursing Delirium Screening Scale (Nu-DESC) and BIS improved early detection of postoperative neurological complications in Post anesthesia care unit (PACU) after elective craniotomies. Yang et al [21] reported that t the number of sedation-related adverse events appears to be lower when BIS was used although the mean level of sedation does not change significantly. Jung et al [22] reported that active assessment and control of sedation significantly reduces the dosage of sedatives in patients receiving mechanical ventilation, and no difference has been observed between clinical assessment based methods and BIS. BIS monitoring was also used in prehospital setting to evaluate the sedative status of patients in emergency situations but was not recommended to guide prehospital sedation since poor correlation of BIS with clinical assessment was observed about the depth of sedation in those circumstances [23]. In our study, we observed good correlation between BIS and RASS with RSS, and there was no significant differences in terms of heart rate, systolic and diastolic arterial blood pressures, and peripheral arterial oxygen percent, and any other sedation related complication.
5.Conclusion
As a result it was concluded that in mechanically ventilated and sedated patients subjective clinical sedation scales such as RSS and RASS are functioning well to monitor light sedation in intensive care units which correlate (negatively) well with BIS monitoring. Objective monitoring systems such as BIS may be more beneficial for monitoring the sedation level in deeply sedated patients.
References
- Soliman HM, Melot C, Vincent JL. Sedative and analgesic practice in the intensive care unit: the result of European survey. Br J Aneasth. 2001; 87: 186-192.
- Jacobi J, Fraser GL, Coursin DB, et al. Clinical Practice guidelines for the sustained use of sedatives and analgesics in the critically ill adult. Crit Care Med. 2002; 30: 119-141.
- Kress JP, Pohlman AS, Hall JB. Sedation and analgesia in the Intensive Care Unit. Am J Respir Crit Care Med. 2002; 166: 1024-1028.
- Jonghe B, Cook D, Griffith L, et al. Adaptation to the intensive care environment (ATICE): Development and validation of a new sedation assessment instrument. Crit Care Med. 2003; 31: 2344-2354.
- Consales G, Chelazzi C, Rinaldi S, De Gaudio A.R. Bispectral Index compared to Ramsay score for sedation monitoring in intensive care units. Minerva Anestesiol. 2006; 72:329-36.
- Ramsay MAE, Savege TM, Simpson BRJ, Goodwin R. Controlled sedation with alphaxolone/alphadolone. Br Med J. 1974; 22:656-659.
- Sessler CN, Grap MJ, Brophy GM. Multidisciplinary management of sedation and analgesia in critical care. Semin Respir Crit Care Med. 2001; 22: 211- 225.
- Sessler CN, Gosnell M, Grap MJ, et al. The Richmond Agitation-Sedation Scale: validity and reliability in adult intensive care patients. Am J Respir Crit Care Med. 2002; 166:1338-1344.
- Ely EW, Truman B, Shintani A, et al. Monitoring sedation status over time in ICU patients: reliability and validity of the Richmond Agitation-Sedation Scale (RASS).JAMA. 200; 289:2983-91.
- Bell JK, Laasch HU, Wilbraham L,et al. Bispectral index monitoring for conscious sedation in intervention: better, safer, faster. Clin Radiol. 2004; 59:1106-13.
- Tonner PH, Wei C, Bein B, Weiler N, Paris A, Scholz J. Comparison of two bispectral index algorithms in monitoring sedation scale in mechanically ventilated critically ill patients. J Anesth. 2010: 24: 394-398.
- Berkenbosch JW, Christopher R., Fichter M., et al. The correlation of the BIS with clinical sedation scores during mechanical ventilation in the pediatric intensive care unıt. Anesth and Analg. 2002: 94: 506-11.
- Crain N, Slonim A, Pollack M. Assessing sedation inthe pediatric intensive care unit by using BIS and the COMFORT scale. Pediatr Crit. Care Med 2002; 3: 11-14.
- Karamchandani K, Rewari V, Trikha A, Batra RK. Bispectral index correlates well with Richmond agitation sedation scale in mechanically ventilated critically ill patients. J Anesth. 2010: 24: 394-398.
- Gu Q, Liu N, Ge M, Gao W. Application of the bispectral index monitor in mechanical ventilation in patients under sedation in the intensive care unit. Zhongguo Wei Zhong Bing Ji Jiu Yi Xue. 2007; 192:101-3.
- Riker RR, Fraser GL. Sedation in the ICU: refining the models and defining the questions. Crit Care Med. 2002; 30: 1661-1663.
- Bard JW. The BIS Monitor: a review and technology assessment. AANA J. 2001; 69: 477-483.
- Kato T, Koitabashi T, Ouchi T, Serita R. The utility of bispectral index monitoring for sedated patients treated with low-dose remifentanil. J Clin Monit Comput. 2012; 26:459-463.
- Yaman F, Ozcan N, Ozcan A, Kaymak C, Basar H. Assesment of correlation between bispectral index and four common sedation scales used in mechanically ventilated patients in ICU. European Review for Medical and Pharmacological Sciences. 2012, 16: 660-666.
- Herrero S, Carrero E, Valero R, Rios J, Fábregas N. Postoperative surveillance in neurosurgical patients - usefulness of neurological assessment scores and bispectral index. Braz J Anesthesiol. 2017; 67:153-165.
- Yang KS, Habib AS, Lu M, Branch MS, Muir H, Manberg P, Sigl JC, Gan TJ. A prospective evaluation of the incidence of adverse events in nurse-administered moderate sedation guided by sedation scores or Bispectral Index. Anesth Analg. 2014; 119:43-8.
- Jung YJ, Chung WY, Lee M, Lee KS, Park JH, Sheen SS, Hwang SC, Park KJ. The significance of sedation control in patients receiving mechanical ventilation. Tuberc Respir Dis (Seoul). 2012; 73:151-61.
- Duchateau FX, Saunier M, Larroque B, Josseaume J, Gauss T, Curac S, Wojcie chowski- Bonnal E, Mantz J. Use of bispectral index to monitor the depth of sedation in mechanically ventilated patients in the prehospital setting. Emerg Med J. 2014; 31:669-72.