Information
Journal Policies
Evaluation of the Concordance of the Results of the Dried Plasma Spot and Liquid Plasma for the Determination of the Viral Load of the HIV in Kinshasa: Preliminary Study
Ben Buland1*a, Berry Bongenia1, Francois Lepira2, Erick Kamangu1,3
2.Service of Nephrology, Department of Internal Medicine, University Clinics of Kinshasa, Faculty of Medicine, University of Kinshasa (UNIKIN), Kinshasa-Democratic Republic of Congo.
3.Service of Molecular Biochemistry, Department of Basic Sciences, Faculty of Medicine, University of Kinshasa (UNIKIN), Kinshasa-Democratic Republic of Congo.
Copyright : © 2018 . This is an open access article distributed under the Creative Commons Attribution License, which permits unrestricted use, distribution, and reproduction in any medium, provided the original work is properly cited.
Objective: This study aims to compare the determination of the Viral Load of HIV using plasma samples and Dried Plasma Spots (DPS) in the context of Biological Monitoring in Kinshasa.
Methods: An experimental study was conducted to determine patients' Viral Load (VL) on liquid plasma and DPS. It was performed at the Molecular Biology Laboratory of the UNIKIN Faculty of Medicine. The size of the population was 48 ARV-naive patients in a reasoned manner in the various selected centers. Five milliliters of blood were collected in a tube with EDTA anticoagulant from the vein of the elbow crease. The collected blood was centrifuged at 1000 g for 10 minutes to obtain the plasma. The blotting paper was prepared from 140 μl of plasma. After extraction of the RNA, the VLs were carried out on different algorithms for DPS and liquid plasma.
Results: Forty-eight (48) plasma samples and DPS were analyzed simultaneously for the determination of the VL. All samples were successfully extracted and amplified. At 60 Cycles, the results reveal 100% amplification for liquid plasma and DPS. The median values of VLs were respectively 4.68 log10RNA copies/ml on plasma and 4.52 log10 RNA copies/ml on DPS. The correlation between the 2 methods was strong and the coefficient R2 was of 0.9452(p< 0.001). The approved limits for both samples are between -1.20 and 0.80 log10 copies/ml and the 30% confidence interval is -0.2 to 0.2.
Conclusion: The results found for the viral load on DPS and liquid plasma had shown that the results were consistent and correlated.
Viral load; Dried Plasma Spot; HIV; PCR; Kinshasa,AIDS
1. Introduction
According to the Organization of United Nations against HIV and AIDS (UN AIDS), the number of new HIV infections for 2013 was closed to 2.1 million people, more than thirty years after the start of the epidemic [1]. Despite substantial funding provided, the response against HIV, especially in sub-Saharan Africa, has given mixed results [1]. Globally, on December 1st, the 2015 UNAIDS report made subject of 36.9 millions of People Living with the Human Immunodeficiency Virus (PLHIV) in 2014 and nearly 2 million news HIV infection [2].
The UNAIDS has launched a new challenge to eradicate the HIV epidemic by 2030, with intermediate targets, called "90-90-90" for 2020 [1]. To reach the 3 x 90%, patients with known Viral Load (VL) should reach viral suppression even in Low to Median Income Countries (LMIC). Over 70% of this population lives in rural areas in these countries without basic infrastructure with difficulties in moving samples to the reference laboratories found in urban areas. Thus the need of introducing Dried Plasma Spot (DPS) in large scale for VL detection in these LMIC. Hence, the aim of this study was to evaluate the correlation between DPS and Liquid Plasma samples in our environment.
2. Methods
The present study was an experimental study carried out with different monitoring and follow -up centers for PLHIV randomly chosen in Kinshasa, Democratic Republic of Congo (DRC). The inclusion of patients was from November 15th, 2016 to May 15th, 2017.
Patients included in this study were HIV positive patients, naive of Antiretroviral Treatment (ART), over 18 years at the time diagnosis, and positive according to the national recommendations [3] and consenting to participate.
The values of the VL count on fluid Plasma and on DPS were the main variables of interest in the present study.
Five milliliters of blood were collected in a tube with anticoagulant EDTA from the vein in the elbow crease. One milliliter of plasma was transferred to a labeled micro-tube and 140 μl of this plasma was deposited on the blotting paper (DPS). The DPS were dried at room temperature for at least2 hours before being sealed in the plastic bags.
The RNA was extracted from 140μl of plasma and 10μl of the internal extraction control (Diagenode RNA- 050.vs1) using the QIA amp RNA Mini Kit from QIAGEN® for RNA extraction [4]. The extracted samples were stored at -20° C in the Molecular Biology Laboratory of the Faculty of Medicine (UNIKIN).
Real-Time Quantitative Multiplex PCR (q PCR) was performed to determine the amount of HIV pro-viral RNA in the samples according to previously described protocols [5-7]. The targeted viral region for amplification is part of the Long Terminal Repeat (LTR) which is a constant and conserved region of genome of HIV type 1 [5,8]. The calibration curve has been plotted with standard controls. The standards used to graph are previously quantized plasmas 102 to 107 viral particles per increment of a logarithm of 10 (Acro Metrix Control Panel # 94-2013). The curves were made on liquid plasma and on DPS separately. The acceptable coefficient for the curve was between -3.40 and -3.10accordingtothe Applied Bio systems (ABS) 7500Fast Real-Time PCR System thermal cycler [8], and between -3.60 and - 2.90 according to the viral quantification protocol by Bio centric [9].
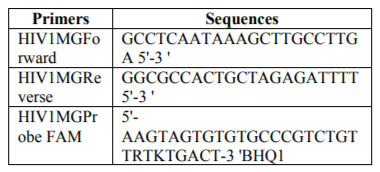
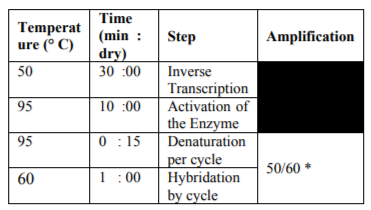
Primers and probes used for the amplifications, as well as PCR cycles are presented in the table 1 and 2.
The data collected were entered on Windows Excel version 2010. The statistical analysis of the results was done on SPSS version 17.0 for Windows. The Pearson Correlation test was used to evaluate the correlations between the different data. The significant value (p) retained for the probability was p< 0.01 for the study. The results were expressed in median [Extreme value]. The sensitivity and specificity has been calculated in relation to the values of plasma VL. The concordance liquid plasma VL and DPS was determined by the Bland Altman Test.
Participation in this study was voluntary and all subjects had previously signed a consent form. The confidentiality of patients had been respected in accordance with the standards of Good Clinical Practice (GCP). The collection of blood samples was done by the technical team of the different centers selected for the study.
3. Results
Forty-eight (48) plasma and DPS samples were analyzed simultaneously for Viral Load (VL) determination. All these samples were successfully amplified according to the protocol. At 50amplification cycles, there was 100% of amplification for the liquid plasma samples and 33% of amplification for the DPS samples. At 60 cycles of amplification, there was 100% of amplification for both assays.
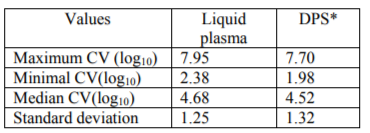
The median value e of VL on liquid plasma was of 4.68 log10 RNA copies/ml with extreme values of2.38 and 7.95 log10 RNA copies of RNA/ml.
The median value of VL on DPS was of 4.52 log10 RNA copies/ml with extreme values of 1.98 and 7.70 log10 RNA copies/ml at the 60-cycle amplification.
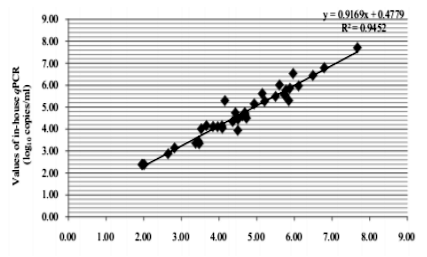
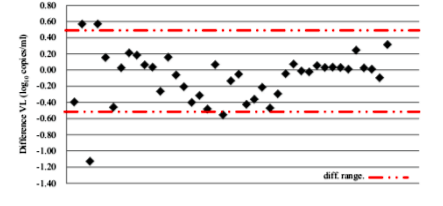
The results of VL were comparable on the 48 amplified samples on DPS and liquid plasma. The degree of association between the two methods was high and the coefficient R2 was 0.9452 (p< 0.001). The merge of 0.5 log10 was used to evaluate the differences between the results of the two values. The dispersion of the values was constant for the 2 methods used; it was included between - 1.13 and 0.57 log10 copies / ml.
To calculate the accreditation limits for this study, it was necessary to calculate(i)the average of the differences (d = - 0.2); (ii) the Standard Deviation (SD) of differences (sdd = 0.5); and (iii) the lower and upper limit (d ± 2 x sdd) which was equal to the interval between -1.20 and 0.80.
To assess the degree of confidence the limits of agreement calculated confidence intervals around the graph Bland-Altman. With 30% of confidence interval, the values were included in the interval between -0.2 and 0.2.
4. Discussion
The aim of this study was to evaluate the correlation between blotting paper (DPS) and liquid plasma or the determination of HIV Viral Load (VL) in our environment, in order of contributing to the management, monitoring and follow up of People Living with HIV/AIDS (PLHIV).
The study involved 48 positive samples collected in different centers of the city of Kinshasa. The samples were aliquoted to give 48 liquid samples and 48 DPS. The results showed amplification of all samples in 100% of the corresponding using 60 cycle’s amplification assays. At 50 cycles, only liquid plasma samples amplified at 100% and 33% of DPS samples amplified. Only high VL samples did amplify on DPS at 50 cycles. These data are consistent with those reported in our environment [12,13].
The Spearman coefficient (R2) found was 0.9452 for both types of samples (liquid plasma and DPS) which were a good and strong correlation coefficient.
These data confirm the literature on the amplifications of DPS and DBS [9,12,13]. Different research groups reported an amplification detection limit in the range of 3.0 log10 and 3.33 log10 RNA copies/ml with the use of blotting paper [9,12,13]. With 20% of the samples having a VL lower than 3.0 log10, the results obtained after amplification in this study met the standards and confirmed the literature [9,12,13].
The margin of ± 0.5 log10 RNA copies/ml was used to evaluate the differences between the results of the two techniques [9]. The dispersion of values was constant for both techniques; it varied in the range.
These data showed a concordance of the results of the viral loads made on the samples on plasma and on DPS, with a mean of the differences of -0.2. This corroborates the literature data reported by Kouassi of Burkina Faso who found a difference average of 0.17 [14].
The approval limits for this work range from - 1.2 to 0.8; they are in the range of -2 to 2 which determines the degree of confidence of the method and when the limits of approval are between the interval -2 to 2, the measure is said to be concordant [10]. The confidence interval in this study was in the interval of -0.42 to 0.21 for 95%; and from 0.2 to 0.2. This shows that the degree of associativity between the two techniques is very significant [10].
5. Conclusion
The results of this study on the comparison of Viral Load on liquid plasma and DPS, as an alternative method for monitoring PLHIV in the environments where resources are limited, gave a strong and good correlation using the Spearman correlation.
References
- UNAIDS. Aide-mémoire Sub-Saharan Africa 2010. www.unaids.org accessed on 15 November 2016
- UNAIDS, 2015 Progress Report on the AIDS Response Around the World, WHO Edition, 2015
- National Program for Combating HIV / AIDS andSexuallyTransmittedInfections (PNLS). Ministry of Public Health, Democratic Republic of Congo. Annual Report. May 2014.
- QIAGEN: QIAamp® Mini DNA and Blood Mini Handbook. 3rd Edition. April 2010: 27-9.
- Rouet F, Foulongne V, Viljoen J, K Steegen, B ecquart P Valea D, Danaviah S, Segondy M, Ve rhofstede, Van de Perre P, for the WHO / ANRS 1289 Kesho Bora Study Group. Comparison of the Generic Viral Load® HIV Assay with Amplicor TM HIV-1 Monitoring v1.5and Nuclisens HIV-1 EasyQ® v1.2 Techn iques for Plasma HIV-1 RNA Quantification of Non-B Subtypes: TheKesho Bora Preparatory Study. Journal of Virological Methods.201 0; 163: 253-7
- Kamangu EN, Chatte A, Boreux R, Kalala RL,Mvumbi GL, Demol P, Vaira D, Hayette MP. Implementation of an In-House QuantitativeReal-Time PCR for Determination of HIVViral Load in Kinshasa. Open Access Library Journal, 2015. 1: e855. http://dx.doi.org/10.4236/oalib.1100855
- Kamangu , EN, Pussy , A., Boreux , R., Susin , F., Kalala, RL, Mvumbi , GL, De Mol, P., Hayette , M-P and VairaD. Comparison of an In - House Quantitative Real - PCR Time andAmpliPrep COBAS/TaqMan Roche for De-Termination of Viral Load for HIV Type 1 Non-B . Open Access Library Journal, 2015; 2: e1402. http://dx.doi.org/10.4236/oalib.1101402
- AppliedBiosystems. www.appliedbiosystems.c om accessed 15 March 2017
- Biocentric. www.biocentric.com accessed March 15, 2017
- Consultation Service in statistical bio CRCHUM, January 2011.www.google.com Accessed June 30, 2017 to 10:30 p.m.
- Kamangu EN, Bulanda BI, Bongenia BI, Botomwito HT, Mvumbi GL, De Mol P, Vaira D, Hayette MP and KalalaRL. Virological Profile of Infected Patients with HIV Starting Antiretroviral Treatment in Kinshasa 2015 ; Open Access Library Journal, 2, e1564. doi : http://dx.doi.org/10.4236/oalib.110 1564
- Chatté Adawaye, Erick Kamangu, Ali Mahamat Moussa,Bertin Tchoumbou,Dolores Vaira, Michel Moutschen. Use of Dried Blood to Improve Diagnosis and Management of HIV in Resource-Limited Settings. World Journal of AIDS. 2013; 3: 251-6.
- Kamangu NE, Chatty A, Boreux R, Kalala LR, LG Mvumbi, Vaira D, Hayette MP. Establishm ent of a Quantitative Real-Time PCR for the determination of HIV viral load in Kinshasa. Journal of Biomedical Research2014 ; 1 (1): 7-12.
- Kouassi Sandrine Isshe. The interest of filter papers (DBS) for the quantification of the Viral Load ARN HIV-1 in the whole blood: comparison with plasma results. Memory publicly supported on 12 May 2010 at the Polytechnic University of Bobo- Dioulasso for graduation from study depth (DEA) of applied biology and of modeling of biologicalsystems. www.google.com . Acces sedJanuary 25, 2017
- Kamangu EN, Chatté A, Susin F, Boreux R, Kalala RL, et al. Genetic Diversity and Antiretroviral Drug Resistance among Drugs-Naïve HIV Type 1 Infected Patients attending Clinics in Kinshasa, Democratic Republic of Congo. 2015; J HIV AIDS Volume1.1: http:// dx.doi.org/10.16966/jha.101


