


|
|
DOI Prefix 10.20431 |
Information
Journal Policies
Benchmark Comparison of High and Low Performers to Identify Key Success Factors in the care of Type 2 Diabetes in Sweden
Sara Ekeblad1, Lina Odevall1, Tony Holm2, Mats Bojestig3, Soffia Gudbjörnsdottir4,5, Claes-Göran Östenson6*
2. Swedish Association of Local Authorities and Regions, Stockholm, Sweden.
3. Jönköping County Council, Jönköping, Sweden.
4. Institute of Medicine, Sahlgrenska University Hospital, University of Gothenburg, Gothenburg, Sweden.
5. National Diabetes Register, Centre of Registers, Gothenburg, Sweden.
6. Department of Molecular Medicine and Surgery, Karolinska Institutet, Stockholm, Sweden.
Copyright : © 2016 Östenson C-G. This is an open access article distributed under the Creative Commons Attribution License, which permits unrestricted use, distribution, and reproduction in any medium, provided the original work is properly cited.
Abstract
Aims: The Swedish National Diabetes Register (NDR) has shown large geographical differences in treatment outcomes for diabetes patients in primary care, both between and within the 21 county councils (CCs). This study was conducted to identify factors associated with high performance in type 2 diabetes (T2D) primary care, based on glycemic and blood pressure control, and use of lipid-lowering medication.
Methods: High and low performing CCs and primary care centers (PCCs) were identified based on 2012 NDR data. Differences in the provision of T2D care were explored using a combination of qualitative and quantitative analysis. Semi-structured in-depth interviews were conducted with 88 selected individuals with key roles in diabetes care, and steering documents and guidelines were analysed.
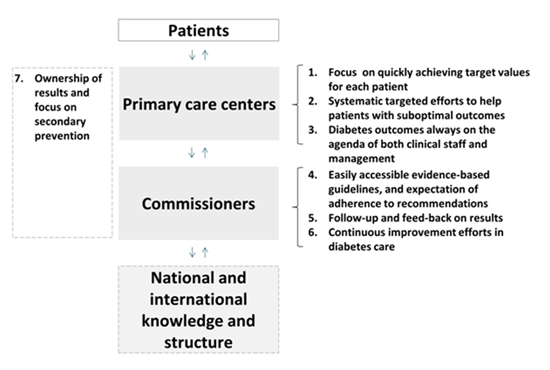
Results: Differences in structure and provision of T2D care between high and low performing CCs and PCCs were identified and described as seven success factors relating to care unit´s structure and delivery of care: 1. Focus on quickly achieving target values for each patient; 2. Targeted efforts to help patients with suboptimal outcomes; 3.Diabetes outcomes always on the agenda of both clinical staff and leadership; 4. Easily accessible evidence-based guidelines; 5. Follow-up and feedback on results; 6. Continuous efforts to improve diabetes care; 7. Ownership of results and focus on secondary prevention.
Conclusion: The identified key success factors in T2D care can serve as a basis for improvement initiatives striving towards evidence-based and equal care.
Keywords: Primary Care, Type 2 Diabetes, Swedish National Diabetes Register
1.Introduction
The prevalence of type 2 diabetes (T2D) is increasing globally and consequently will contribute to rising health care costs, mainly due to diabetes complications including retinopathy, nephropathy, foot ulcers and cardiovascular diseases [1,2]. In recent years, large trials have shown the importance of strict control of glycaemia, blood pressure and lipids to reduce the risk of these complications and premature mortality [3,4].
In Sweden, most people with T2D attend primary care centers (PCCs),small clinics with primary care physicians and nurses, but are occasionally referred to specialist care in hospitals, e.g. for initiation of new therapy or treatment of diabetes complications. Local authorities are responsible for commissioning both primary and secondary health care. This is carried out through 21 separate county councils (CCs), politically led organisations which run most PCCs and hospitals. Even though both financing and provision of health care sit at a local level, many health care regulations and quality initiatives are nationally driven. Since 2010 Sweden has evidence-based national guidelines for diabetes care issued by the National Board of Health and Welfare. CCs, PCCs and individual clinicians have however significant latitude with regards to local adjustment and interpretation of guidelines, and local differences in treatment practice are seen. In 2012 the government and the Swedish Association of Local Authorities and Regions initiated the Swedish National Diabetes Council to promote evidence-based practice and increase the quality of diabetes care.
Since 1996, information concerning the majority of diabetes patients has been reported to a national quality registry, the Swedish National Diabetes Register (NDR). The NDR contains several variables including demographic data, diabetes duration, treatment modalities, as well as various risk factors and diabetes complications, and contains data on more than 350,000 patients, i.e. almost 90% of all known diabetes cases in Sweden [5,6].Analysis of 2011 NDR data, focusing on glycosylated haemoglobin A1c (HbA1c, reflecting blood glucose control), blood pressure (BP) and usage of lipid lowering medication in diabetes patients in primary care (a patient group that consists almost exclusively of patients with T2D) showed wide differences between CCs, but also between PCCs within each CC. The aim of this study was to identify and describe factors, mainly related to structure and provision of the T2D primary care, that could help explain these differences in performance. This was done by comparing high and low performing CCs and PCCs,using a qualitative as well as quantitative approach. A starting point was to explore factors relating to the different levels of the organisation of care; from the clinical staff (micro level) and operational management (meso level) to the highest strategic management in the CCs (macro level). The most apparent differences associated with high performance were synthesised into seven key success factors, which are presented here.
2.Methods
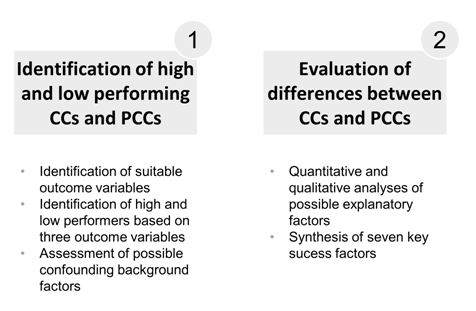
The study was carried out in two phases:1) Identification of high and low performing CCs and PCCs, and 2) Evaluation of differences between high and low performers (Figure 1). The study was initiated by the Swedish National Diabetes Council and was carried out by researchers at the Karolinska Institutet and Health Navigator AB in the spring of 2013. Ethical approval was not required as the study was conducted as part of a quality improvement initiative, based on pre-existing national aggregated data.
A total of 13 outcome variables (Supplementary table 1) were assessed for suitability for selection of high and low performers. In dialogue with five national diabetes experts, and based on relevance for patient health outcomes, potential for the health care system to influence results in the short term, and registry data quality, three outcome variables were chosen to identify high and low performing CCs: the proportion of diabetes patients within primary care (almost exclusively T2D) with:1) HbA1c >73mmol/mol (DCCT = 8.8%), 2)blood pressure ≥ 150 mm Hg and 3) lipid lowering medication. These outcome variables are referred to as outcome variable 1,2 and 3.Outcome variables 2 and 3 reflected only patients less than 75 years of age.
Selection of CCs to be included in the study was based on outcome variable 1 and 2, but above- and below-average performance, respectively, on outcome variable 3 was also required. In addition, CC size and geographical location were taken into account, to ensure a nationally relevant selection of CCs. The health care director (head of the health care organisation) in each selected CC was invited to join the study, and all eight agreed to participate. PCCs were selected by the study contact from one high performing and two low performing CCs, with instructions to use glycemic control (outcome variable 1) as the basis for selection. Selected PCCs were invited to participate, and all agreed.
To assess the degree to which the outcome differences between the high and low performers could be explained by selected factors outside the control of health care providers (“background factors”), a possible linear relationship between such factor sand outcome variables 1, 2 and 3 (described above)were assessed through multivariate and simple linear regression. Analysis was performed using the statistical software R.A total of five factors, commonly suggested as confounding factors and where data was available, were analysed:1) level of unemployment, 2) population mean age, 3) the proportion of population born outside the European Union and Iceland, Liechtenstein, Norway, Switzerland, 4) population education level, and 5) the proportion of population (< 75 years of age) with a BMI> 35kg/m2. Outcome variables 1, 2 and 3 were used as dependent variables, and the background factors as independent variables using values for each CC as observations. Each coefficient was tested with a two-sided student t- test with a level of significance of α=0.05. The goodness of fit for the regression model was evaluated with an F-test and the coefficient of determination. In addition, a separate simple linear regression was conducted to assess a possible PCC level linear relationship between socio-economic status (Care Need Index, CNI, a social deprivation index. A high CNI indicates poor socio-economic status. CNI was originally developed for measuring the potential workload of general practitioners in Swedish primary care [7]) and outcome variable 1 (analysis done in one CC). Latest available data at the time of analysis (2011) from NDR, Statistics Sweden and the Health Care and Regional Development statistics was used for all the above mentioned analyses. Three out of 21 CCs were excluded from the analyses that included outcome variable 1 due to data quality challenges.
To identify differences between high and low performers, both quantitative and qualitative methods were used. The most apparent differences associated with high performance were synthesised into seven key success factors.
Quantitative analyses included: 1) diabetic medication use: comparison of average number of defined daily doses (DDD) of insulin per patient with known diabetes, and proportion of the total number of diabetes patients with insulin treatment(per CC), 2) staffing levels: comparison of overall number of listed patients per full-time primary care specialist physician (per CC) and 3) primary care budget: simple linear regression analysis of primary care budget (Swedish krona/inhabitant)and outcome variable 1 (per CC). Latest available data at the time of analysis (2012) from the Swedish Prescribed Drug Registry, The Swedish Medical Association survey of staffing in primary care, and NDR were used.
Documents studied included: 1) medical guidelines (regarding format and medical content), 2) tender documents/request for proposals (regarding specific requirements such as staffing levels and education) and 3) care reimbursement models (regarding overall reimbursement model, and specifically the use of performance-based compensation). Similarities and differences were noted.
Collection and analysis of interview data. In-depth interviews were conducted with key decision makers in each selected CC (3-10 interviews per CC to a total of 44 interviews). Respondents were selected by each CC with the requirement that respondents from all parts of the organisation (regional political leadership, commissioners, and diabetes councils/boards) would be included. Interviews were of 45-75 minutes duration, conducted at the respondents’ work place or by telephone, using a semi-structured interview guide. The interviews focused on mapping structure and provision of local T2D care, with an emphasis on the respondent’s understanding of factors influencing the care and the selected outcome variables and how each factor affected the actual care provided (“how does this influence the actual care that is given to the patient?”). The interviews were conducted by two researchers and were documented through extensive notes. To ensure consistency, half of the interviews were supervised by a senior researcher who provided feedback and support. Frequent discussions of preliminary insights were held to guide further interviews. In addition, a total of 22 in-depth interviews were carried out with management and clinical staff at four high and six low performing PCCs. These interviews were conducted as described above with focus on the actual care given at the PCC and were somewhat shorter (30-60 minutes).
Thematic analysis of the collected interview data was done to identify differences between high and low performing CCs and PCCs [8].Each researcher, together with the senior researcher, coded each interview using a coding structure used to identify factors related to all levels of care including the clinical staff (micro level), operational management (meso) and the highest strategic management in the CCs (macro level). The generated codes were grouped into major themes highlighting aspects in differences and similarities in diabetes care, as well as the structure and commissioning of this care.
3.Result
Comparing CCs, clear differences in diabetes outcomes were seen; the proportion of patients with an HbA1c >73mmol/mol had an inter quartile range (IQR) of 1.83 (median of 8.6%), the proportion of patients with blood pressure ≥ 150 mm Hg had an IQR of 3.00 (median 17.8%) and the proportion of patients on lipid lowering medication had an IQR of 5.95 (median 66%)(Example was shown in Figure 2). Based on these differences, four high and four low performing county councils were identified. The portion of patients with HbA1c >73mmol/mol ranged from 6.2-8.2% in the high performing CCs and from 9.5 – 11% in the low performing CCs. The proportion of patients with blood pressure ≥ 150 mm Hg ranged from 13.1 – 17.5% and 18.4-23.3%and the proportion of patients on lipid lowering medication ranged from 61.2-71.9% and from 56 – 61.8% in the high and low performing CCs respectively(Supplementary table 2). In addition, four high and six low performing PCCs were selected to join the study.
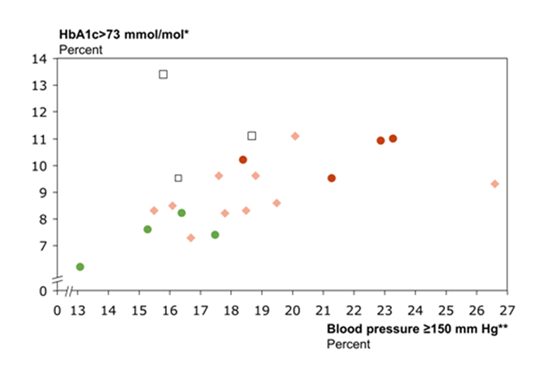
Note: Green circles denote high performing county councils and orange circles denote low performing county councils, white squares denote three of the 21 county councils which were excluded due to data quality challenges and pink diamonds denotes the rest of the county councils.
* The proportion of diabetes patients in primary care with an HbA1c >73mmol/mol
** The proportion of diabetes patients (< 75 years) in primary care with a blood pressure ≥ 150 mm Hg
Multivariate and individual simple linear regression analyses did not show any statistically significant linear relationship between any of the studied background factors: 1) level of unemployment, 2) mean age, 3) the proportion of population born outside the European Union and Iceland, Liechtenstein, Norway, Switzerland, 4) level of education and 5) the proportion of population (< 75 years of age) with a BMI> 35kg/m2) and the three outcome variables), when comparing CCs (Example shown in Figure 3 and Supplementary table 3).
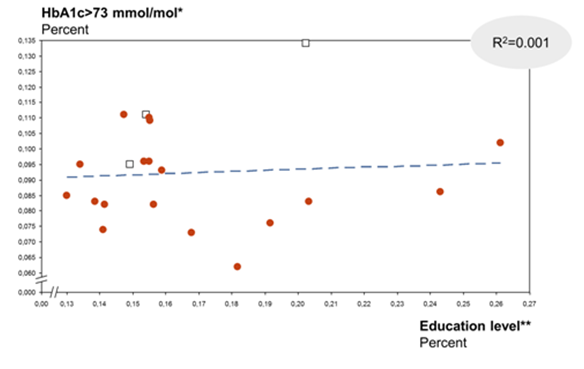
Note: White squares denote three of the 21 county councils which were excluded due to data quality challenges.
* The proportion of diabetes patients in primary care with an HbA1c >73mmol/mol
** Education level indicates the proportion of the population with tertiary education> 3 years or postgraduate education
On PCC level there was a weak but statistically significant (p-value: 0.00, β=0.013 (95 % CI 0.007 -0.0193), adjusted R2=8 % linear relationship between patient population socio-economic status and outcome variable 1 (Figure 4).
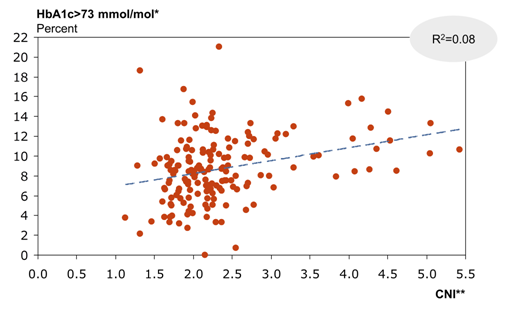
* The proportion of diabetes patients in primary care with an HbA1c >73mmol/mol
** Care Need Index per PCC
No clear differences were seen between high and low performing CCs regarding aspects of insulin use. The average number of insulin DDDs per diabetes patient (both type 1 and type 2 diabetes) ranged from 212 to 281 (median 227) and 209 to 244 (median 219), and the proportion of the total number of diabetes patients using insulin ranged from 45 to 53% (median 47%) and 45 to 51% (median 46%) in high and low performing CCs respectively. The number of listed patients per full-time specialist ranged from 1955 to 2275 (median = 2048) and 1755 to 2181 (median = 1840), between high and low performing CCs respectively.
Individual simple linear regression for outcome variable 1 (proportion of patients with an HbA1c >73mmol/mol) and primary care budget did not show any statistically significant relationship (p-value: 0.299, β=0.000 (95% CI -0.000–0.000).
No systematic differences between high and low performing CCs were identified in tender documents/ RFPs or reimbursement models. Different reimbursement models and care requirements/specifications were used, but no apparent pattern distinguishing high and low performing CCs could be identified.
Comparison of treatment guidelines showed differences in both treatment recommendations and guideline format. In general, high performing CCs were more specific in their recommendations regarding early initiation of drug treatment. Three of four high performing CCs recommended initiation of metformin at the time of, or within a maximum of 1-3 months of, diagnosis, while three of the four low performing CCs recommended metformin less specifically “after lifestyle interventions”. In addition, one of the high performing CCs included specific treatment recommendations coupled with HbA1c cut-off levels. In addition, differences in guideline length were seen between CCs, of possible importance for ease-of-use for the practitioners. Of the four high performing CCs, three had T2D guidelines that were 8 pages or less, while all low performing CCs had guidelines 15 pages or longer (range 15-44 pages). Short and easily accessible guidelines were also frequently mentioned in interviews as contributing to use and to physician adherence to recommendations.
Analysis of the collected interview data yielded information on a number of similarities and differences between CCs and PCCs, regarding different aspects of the structure and provision of care, including the clinical staff and operational management at the PCC level and the strategic management in the CCs. Systematic differences between high and low performing CCs and PCCs are described below.
Synthesis of the most apparent differences associated with high performance identified in interviews and above mentioned analyses were synthesised into seven key success factors(described below). These success factors related to PCC design and delivery of healthcare (factor 1-3), CC leadership and management of care (factor 4-6) and the culture that permeates the care organisation as a whole(factor 7) (Figure 5) .
- Focus on quickly achieving target values for each patient
Respondents in high performing PCCs described how clinical staff emphasised the importance of quickly achieving target values for each patient and a structured approach to follow-up appointments. Three of four high performing PCCs described a proactive treatment strategy aggressively aiming for target values, while none of the six low performing PCCs described themselves as proactive, but rather allowing more time for lifestyle interventions before turning to drug therapy. All high performing PCCs described that they actively schedule follow-up appointments for the majority of their T2D patients, while the same was true only for two of the six low performing PCCs.
“We start metformin at an early stage; this also shows the patients how important we think this disease is” (high performing PCC)
”We do not have a routine for scheduling appointments for [T2D] patients, it is up to each patient to contact us” (low performing PCC) - Systematic targeted efforts to help patients with suboptimal outcomes
Respondents at all four high performing PCCs described and emphasised a differentiated care approach, with strategies for proactive identification of patients with suboptimal outcomes, coupled with targeted efforts including more frequent contact. Low performing PCCs described a general aim to have more frequent contact with high-risk patients, but did not describe a differentiated appointment frequency or specific strategies to identify and target these patients, but rather described using a routine appointment schedule for most patients.
”We call [T2D] patients mostly on routine; we should call them more based on need” (low performing PCC)
”Some of our [T2D] patients need more than ten health care visits per year, and we are undoubtedly providing that” (high performing PCC) - Diabetes outcomes always on the agenda of both clinical staff and management
All four high performing PCCs described that the management is dedicated to T2D care quality and regularly discusses outcomes and improvement possibilities with clinical staff, at least every three months. Low performing PCCs did not describe any structured or regular discussion about diabetes outcomes, but rather only sporadic or no discussion. At the time of interview, respondents at all four high performing PCCs knew their diabetes outcomes as reported to NDR, as well as how their results compared to other PCCs. Two of the low performing PCCs were not at all familiar with their outcomes, and the remaining four did not know how their results compared to other PCCs.
“PCC [T2D] outcomes are not communicated” (low performing PCC)
“We have no system for getting our results from the national diabetes register, and we do not even know how to do it” (low performing PCC) - Easily accessible evidence-based guidelines, and expectation of adherence to recommendations
Respondents from high performing CCs described how CC care commissioners ensure that relevant (new) knowledge is easily accessible in an adequate format for use in primary care. Specifically, they described to-the-point medical guidelines with straight-forward recommendations (in line with the above finding of shorter guidelines with more direct treatment recommendations in high performing CCs). They also described extensive efforts to align primary care behind new treatment guidelines through co-development and implementation initiatives, as well as clear messages of high expectations regarding care quality and adherence to recommendations. Low performing CCs described a lack of diabetes treatment guidelines (two CCs) or difficulties in implementing them (two CCs).
“There has to be local alignment around a treatment guideline before it can be used county-wide” (high performing CC) - Follow-up and feed-back on results
Respondents from the high performing CCs described systematic follow-up with the commissioning organisation including regular feedback and clear accountability regarding outcomes. In all high performing CCs,individual PCC results are shared internally. The respondents described that sharing of results internally stimulates comparison and a positive competition between PCCs. Respondents from low performing CCs describe a more ad hoc follow-up , with only limited feedback on T2D outcomes. In at least one CC, NDR data was not at all used as a basis for dialogue with PCCs. Only two of the four low performing CCs openly shared outcome data on a PCC level and in two CCs, this information was described as being too sensitive.
”We can login to the primary care web and see T2D outcomes for all PCCs in the county, and compare our results“ (high performing CC)
“If we want the PCCs to report outcomes, we have to make sure that they are being followed-up and receive feedback” (high performing CC) - Continuous improvement efforts in diabetes care
In all high performing CCs, respondents described how T2D care has been a strategic priority for regional political leadership for many years. This strategic focus was described as having contributed to a focus on T2D throughout the healthcare community, and having included improvement initiatives that have made tangible contributions to improved outcomes. None of the low performing CCs described T2D care as a long-term strategic priority or a history of diabetes initiatives. Two of the CCs described a recent increased focus on T2D based on previous unsatisfactory results compared to other CCs.
“We have just recently started to prioritise diabetes care by developing our own treatment guidelines” (low performing CC) - Ownership of results and focus on secondary prevention
High performing CCs and PCCs described a culture of ownership of T2D outcomes; several respondents at different levels in the organisation expressed a feeling of personal responsibility and mandate to improve patient outcomes. Respondents in these CCs and PCCs, at all levels, also described a focus on prevention of diabetes complications and a strong belief that risk factor management is a key objective in T2D care.
Respondents from low performing CCs and PCCs described a less developed feeling of ownership for T2D outcomes and described how bad results are often excused rather than acted upon. The respondents also described a lack of focus on prevention of complications, including scepticism regarding the importance of prevention of complications through targeting risk factors (with immediate quality of life often seen as more important).
”We were the first to use guidelines, and we have a strong tradition of following them” (high performing CC/PCC)
“There is a culture of ' it is not possible to apply the medical guidelines to my patients'” (low performing PCC)
4.Discussion
Analysis of data from the Swedish NDR showed large differences between CCs and PCCs, respectively, regarding HbA1c values, blood pressure and the use of lipid lowering medications within primary care in Sweden. To explore potential reasons for these differences and identify key success factors associated with high performance, CCs and PCCs with better outcomes were compared to CCs and PCCs with less good outcomes, and differences in the provision of T2D care were explored using a combination of quantitative and qualitative analysis. The most apparent differences associated with high performance were synthesised into seven key success factors relating to the PCCs design and structure for delivery of healthcare, the leadership and management of care and the culture that permeates the care organisation as a whole.
The primary aim of the study was to describe key success factors that can be of use as a basis for comparison and improvement initiatives in Swedish T2D primary care, but the described factors are likely also relevant in other countries. A study of T2D primary care in Denmark points to the importance of e.g. feedback, clinical guidelines, and individual treatment goals to lower the risk of diabetes complications [9], factors similar to those described here. Some or all of the identified success factors can be assumed to be generic, i.e. to be relevant for other chronic diseases e.g. congestive heart failure or asthma. In addition, a similar benchmark approach could be relevant for identifying success factors in other areas. In fact, similar studies, based on Swedish national quality registers, have been conducted recently within stroke (unpublished data)and nosocomial infections [10], the latter receiving media and health care community attention.
This study has a number of strengths. Quality registry data are often used to describe care outcomes and e.g. geographical differences. This study aims to elucidate reasons behind these differences and identify factors that can be of practical use to overcome these differences and provide a more equal care. A crucial strength is the usage of underlying data from the unique Swedish NDR, allowing analysis of almost 90% of patients with T2D in Sweden. The study highlights the enormous potential for insight associated with high quality national registry data. Another strength is the benchmark approach, where insights are gained from comparison of high versus low performers. This approach is often used in the study of successful companies, but can be of use also in a healthcare setting. The fact that the studied CCs were well distributed in the country (regarding both size and location) gives the results a greater relevance for overall T2D care in Sweden. Further, the span of the key success factors, encompassing all levels of the health care organisation, can make the factors more relevant to improvement initiatives on several levels. Lastly, the combination of a qualitative and quantitative approach enables elucidation of differences from a number of different perspectives, providing more insights.
The study also has some weaknesses and limitations. The approach used is not exhaustive and there are most likely additional success factors in T2D care. In this study, it was for example not possible to quantify and compare important factors such as primary care staffing (density or continuity) or competence (educational level or experience), factors which may play an important role. It is also potentially difficult to determine causality (as opposed to correlation) with regards to aspects of the structure of care and medical outcomes. The factors described here are associated with good outcomes, but it is not certain that they for an individual PCC or CC (fully) explain good outcomes. For example, it is possible that PCCs with good outcomes are more likely to know their results, rather than the other way around. However, the fact that the studied background factors, factors suggested to contribute to differences in outcomes, did not explain the differences seen supports the notion that the differences in outcome are related to differences in the care given. An additional weakness is the risk of bias. As the interviews could not be conducted blindly there is a risk of a skewed interpretation of interview responses. Also, while the use of semi- structured interviews enables identification of many possible explanatory factors, it also means that interviews are not identical, which might influence the answers given by the respondents. Overall however, we believe that the study’s strengths described above outweigh its limitations.In conclusion, we think that the identified key success factors in T2D care can serve as a basis for improvement initiatives striving toward evidence-based and equal care.
5. Acknowledgements
The study was funded by the Swedish Association of Local Authorities and Regions and represents a national initiative with the ambition to increasingly use Sweden’s often unique national quality registry data to gain insight into quality challenges and improvement potential through comparisons between health care providers.
Ethics
Data from both the patient register and interviews were anonymised after collection and categorisation. As prescribed by Swedish ethics rules, there is no possibility to trace individual data in the final publication.
References
- IDF, International Diabetes Federation. IDF DIABETES ATLAS. 2013. 6th edition.
- Gillies, C. L., P.C. Lambert, K.R. Abrams, A.J. Sutton, N.J. Cooper, R.T. Hsu, M.J. Davies, and K. Khunti. 2008. "Different strategies for screening and prevention of type 2 diabetes in adults: cost effectiveness analysis." British Medical Journal 336:1180–1185.
- Yu, P. C., Z. Bosnyak, and A. Ceriello. 2010. "The importance of glycated haemoglobin (HbA(1c)) and postprandial glucose (PPG) control on cardiovascular outcomes in patients with type 2 diabetes." Diabetes Research Clinical Practice 89:1–9.
- Bianchi, C., and S. Del Prato. 2011. “Metabolic memory and individual treatment aims in type 2 diabetes--outcome-lessons learned from large clinical trials.” TheReview of Diabetic Studies 8: 432–440.
- Gudbjörnsdottir, S., J. Cederholm, P.M. Nilsson, and B. Eliasson. 2003. "The National Diabetes Register in Sweden: An implementation of the St. Vincent Declaration for Quality Improvement in Diabetes Care." Diabetes Care26:1270–1276.
- NDR, National Diabetes Register. 2014. Nationella Diabetesregistret-Årsrapport 2013 års resultat (report in Swedish with English summary).
- Malmström, M., J. Sundquist, M. Bajekal, and S.E.Johansson. 1998. "Indices of need and social deprivation for primary health care." Scandinavian Journal of Social Medicine26: 124–130 .
- Boyatzis, R. E. 1998. “Transforming qualitative information: Thematic analysis and code development.” p. 184. London: SAGE Publications.
- Hansen, L. J., V. Siersma, H. Beck-Nielsen,and N. de Fine Olivarius. 2013. "Structured personal care of type 2 diabetes: a 19 year follow-up of the study Diabetes Care in General Practice (DCGP)". Diabetologia56:1243–1253.
- SKL, Sveriges Kommuner och Landsting. 2014. Vårdrelaterade infektioner - Framgångsfaktorer som förebygger (report in Swedish).